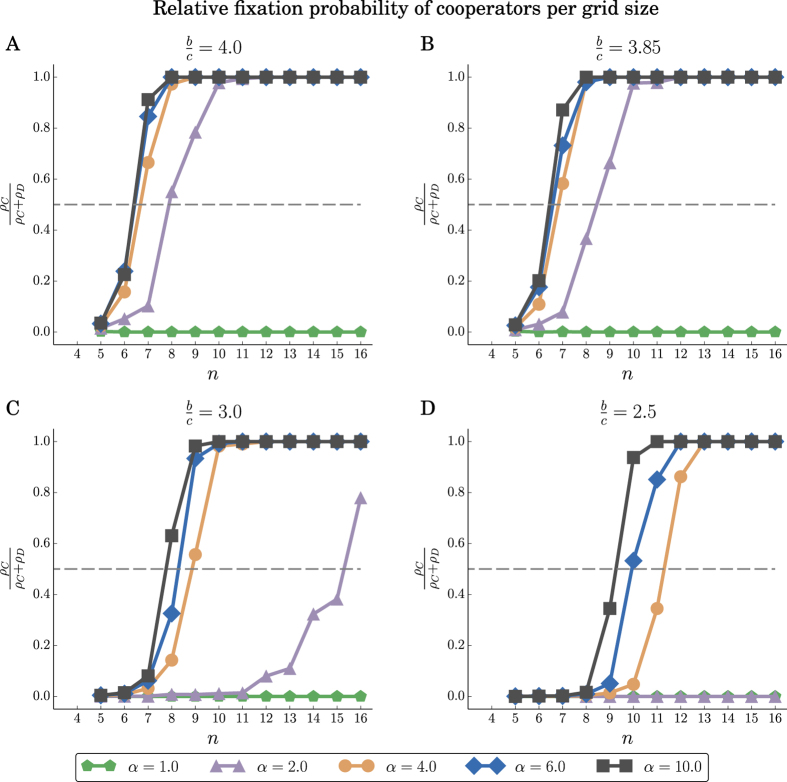
Figure 7. LNR rule.
Relative fixation probability  of cooperators in n × n grids, for different values of n, and benefit-to-cost ratios b/c. The fixation probabilities ρC (resp. ρD) correspond to a single cooperator (resp. defector) mutant in a population of defectors (resp. cooperators). db denotes the death-birth process run for the same parameters. As b/c and α increase, ρ also increases and exceeds 0.5, and cooperation is favored. The fixation probabilities are averages over 104 replicates.

