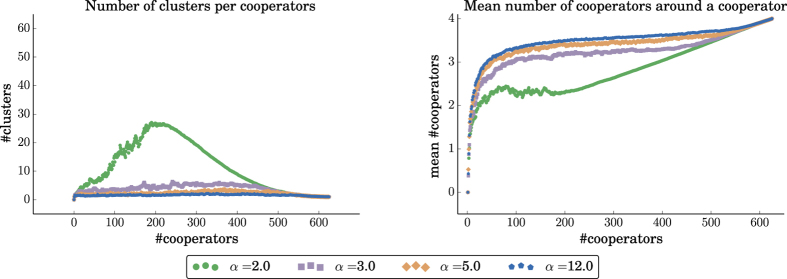
Figure 9. Statistics on a 25 × 25 grid of cooperators with an initial cluster 2 × 2 of cooperator mutants, for b = 3 and different values of the repulsion force α.
Data points are averages over 200 replicates. Left: The increase in the number of cooperators in the grid leads to the formation of cooperator clusters. Higher values of the repulsion force lead to fewer, larger clusters. Right: The average number of cooperators around a cooperator as the number of cooperators increases. Higher values of the repulsion force lead, on average, to more cooperators per cooperator. The difference is more pronounced when the cooperators are the minority in the population (i.e., left part of the figures).

