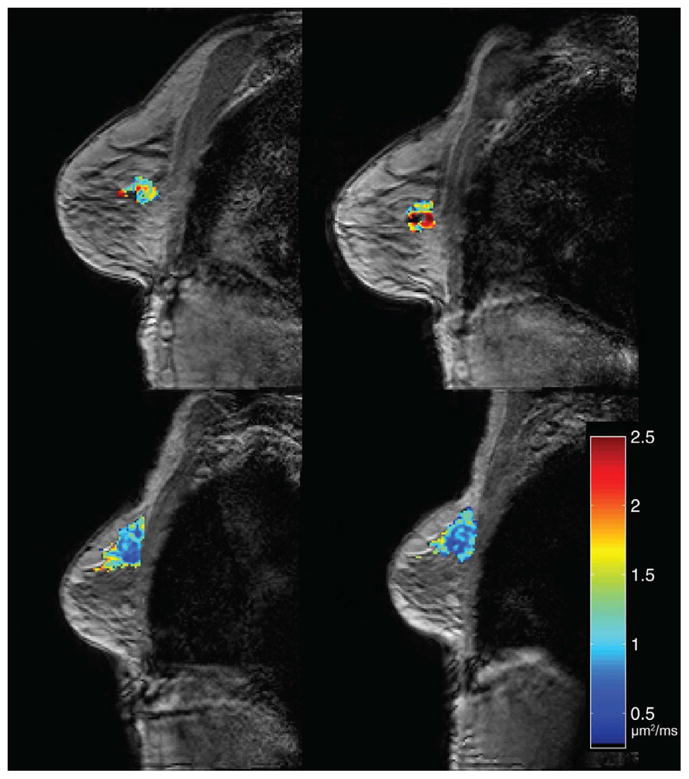
Figure 3.

Changes in ADC in response to neoadjuvant therapy in breast cancer can be measured early in the course of therapy. Shown here are examples of ADC maps acquired before the start of therapy (left column) and after one cycle of therapy (right column) for a patient who went on to have a pathological complete response (top row) and a patient who did not respond (bottom row). (ADC values are shown in units of μm2/ms.)
