. 2015 Sep;110(6):814–816. doi: 10.1590/0074-02760150216

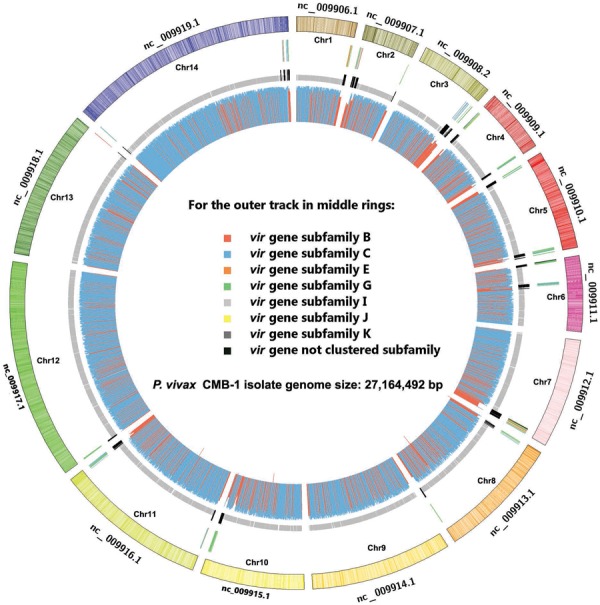
Genomic map of Plasmodium vivax China-Myanmar border area (CMB)-1 isolate. The outermost circle shows the whole genome ofP. vivax Salvador I reference strain. The next ring represents the location of 295 vir genes, each subfamily marked in different colour. The third ring shows the coding sequences zone of CMB-1 isolate scaffolds and vir gene orthologs are indicated by black. The inner circle shows the genomic map of P. vivax CMB-1 isolate and the histogram represents the degree of similarity (blue: identity > 99%). The figure was drawn using Circos (Krzywinski et al. 2009) and alignment was performed using MUMmer 3.0 (Kurtz et al. 2004).
Genomic map of Plasmodium vivax China-Myanmar border area
(CMB)-1 isolate. The outermost circle shows the whole genome ofP.
vivax Salvador I reference strain. The next ring represents the
location of 295 vir genes, each subfamily marked in different
colour. The third ring shows the coding sequences zone of CMB-1 isolate scaffolds
and vir gene orthologs are indicated by black. The inner circle
shows the genomic map of P. vivax CMB-1 isolate and the histogram
represents the degree of similarity (blue: identity > 99%). The figure was
drawn using Circos (Krzywinski et al. 2009)
and alignment was performed using MUMmer 3.0 (Kurtz
et al. 2004).