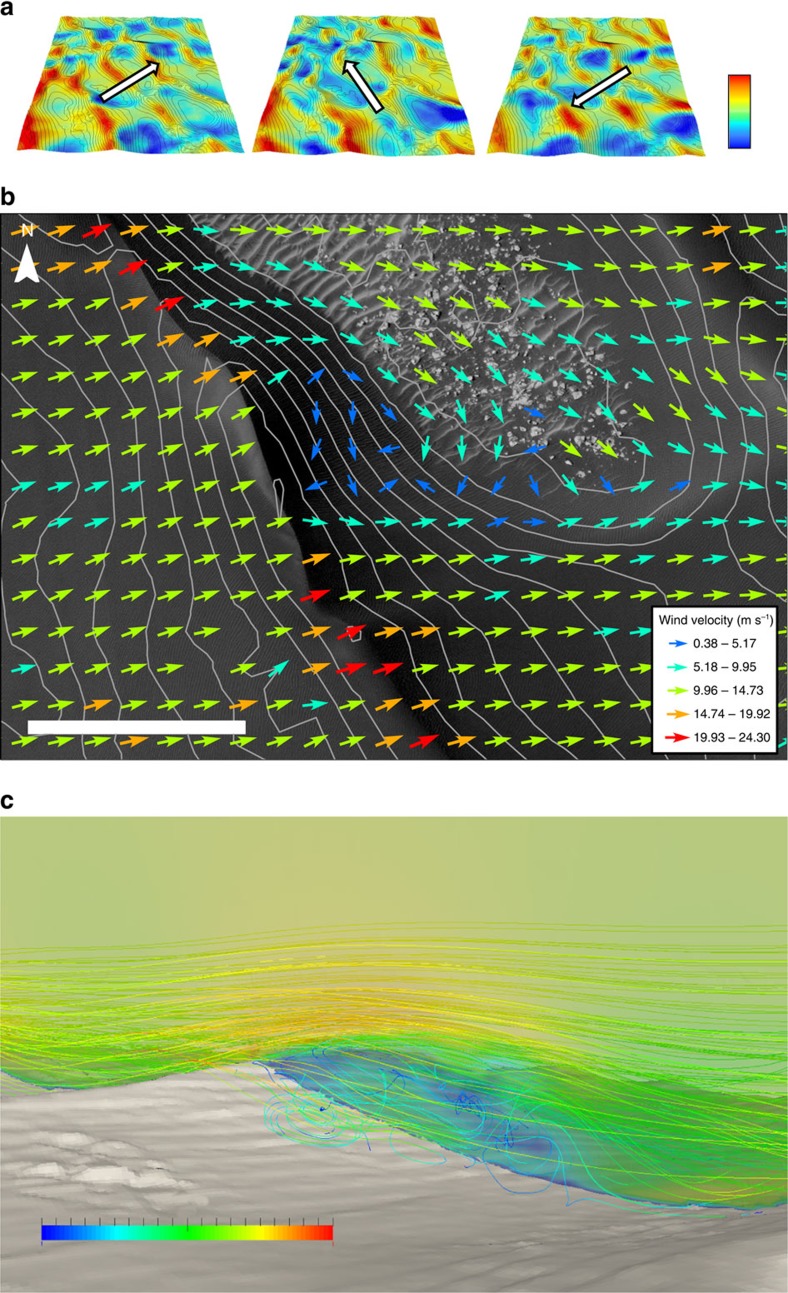
Figure 2. Airflow modelling results near the dune field surface from three simulated directions.
(a) Primary, secondary and tertiary wind flow at 3 m above the surface over the entire dune field surface identified in Fig. 1b. Note: scale bar range is 0 m s−1 (blue) to 21 m s−1 (red). These wind directions were adopted from Fenton et al.8 who used the slip-face dip azimuths of transverse ridges to derive the primary secondary and tertiary directions. The arrow in the centre of each image represents the incident wind direction at the boundary of the computational domain. Data show topographically accelerated wind velocities at dune crests with maximum wind speeds of 24.3 m s−1 and ‘dead zones' (velocities ≤1 m s−1) in the interdunes for all three modelled winds. Contour data at 10-m interval derived from a DTM was built using HiRISE stereo image pairs PSP_003800_1325 and PSP_004077_1325. The DTM data were made available by NASA/JPL/University of Arizona. The region shown in a is the same as that delineated in Fig. 1c. (b) Flow steering by a transverse dune (100 m high) under primary incident wind conditions (239°) south of site 8 (fig. 1c). Vectors indicate wind flow at 3 m above the surface, spaced at 50-m intervals. Contours are plotted at 10-m intervals. Note: scale bar range is 300 m. (c) A 3D view of the detached flow for primary winds (239°) at site 8 (location in fig. 1c). The perspective of the image is towards the north-west. Incident wind flow (m s−1) is moving from left to right in the image. Site 8 is situated immediately north of the frame in c. Note: scale bar range is 0 m s−1 (blue) to 20 m s−1 (red).

