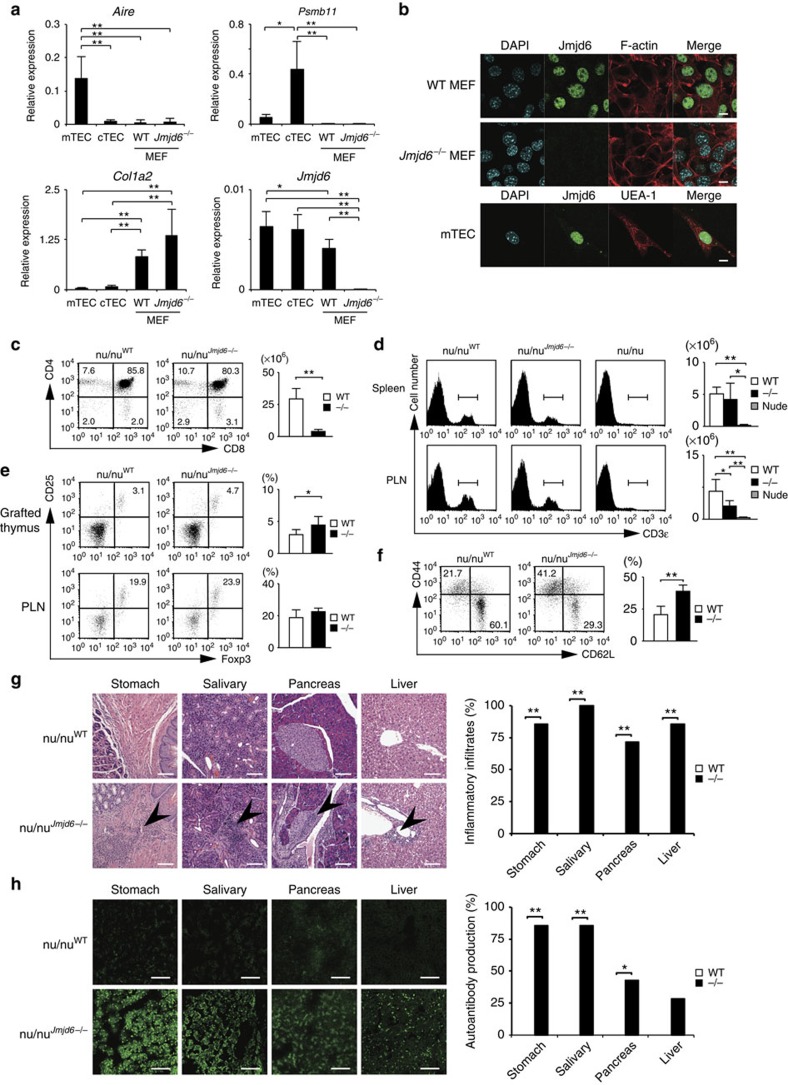
Figure 1. Jmjd6 expression in thymic stroma is required for T-cell tolerance induction.
(a) Real-time PCR analyses for Jmjd6 expression in mTECs, cTECs and MEFs. (b) Immunofluorescence staining showing nuclear localization of Jmjd6. UEA-1 was used to detect mTECs. Data are representative of two independent experiments. (c) Expression of CD4 and CD8 on thymocytes differentiated in the grafts. The number of total thymocytes was compared between nu/nuWT (n=8) and nu/nuJmjd6−/− mice (n=7). (d) The numbers of CD3ɛ+ T-cells in the spleen and PLNs were compared among nu/nuWT (n=8), nu/nuJmjd6−/− (n=7) and nude (n=3) mice. (e) The numbers of of CD25+Foxp3+ regulatory T-cells in the grafted thymi and PLNs were compared between nu/nuWT (n=8) and nu/nuJmjd6−/− mice (n=7). (f) Expression of CD44 and CD62L on PLN CD4+ T-cells from nu/nuWT (n=8) and nu/nuJmjd6−/− mice (n=7). (g) Haematoxylin and eosin staining of tissues from nu/nuWT and nu/nuJmjd6−/− mice. Scale bars, 100 μM. The percentage of each organ with inflammatory infiltrates was compared between nu/nuWT (n=8) and nu/nuJmjd6−/− (n=7) mice. (h) Immunofluorescence staining showing the presence of autoantibodies (green) in nu/nuJmjd6−/− mice. Scale bars, 100 μM. The percentage of mice with autoantibodies against each tissue was compared between nu/nuWT (n=8) and nu/nuJmjd6−/− mice (n=7). Data are collected from four (a), six (c–g) and three (h) separate experiments and are expressed as mean±s.d. *P<0.05; **P<0.01 (two-tailed Student's t-test).

