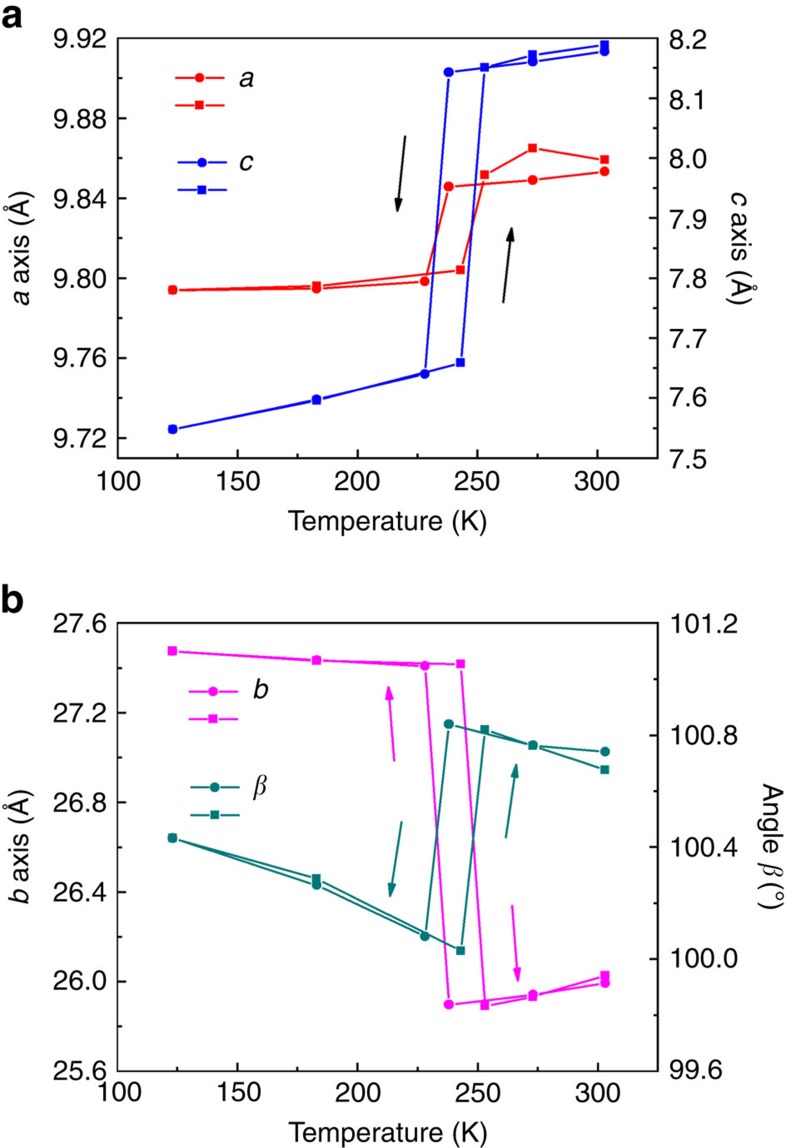
Figure 3. Cell metrics as a function of temperature.
Variable-temperature single-crystal X-ray diffraction data of complex 1 were repeatedly collected for the same crystal in the range 123–303 K (heating, filled squares; cooling, filled circles). (a) Changes in the crystallographic a and c axes. (b) Variations of the angle β and the crystallographic b axis. The length of the b and c axes exhibit a reversible and abrupt change at ∼240 K and the percentage change is ∼5, respectively.

