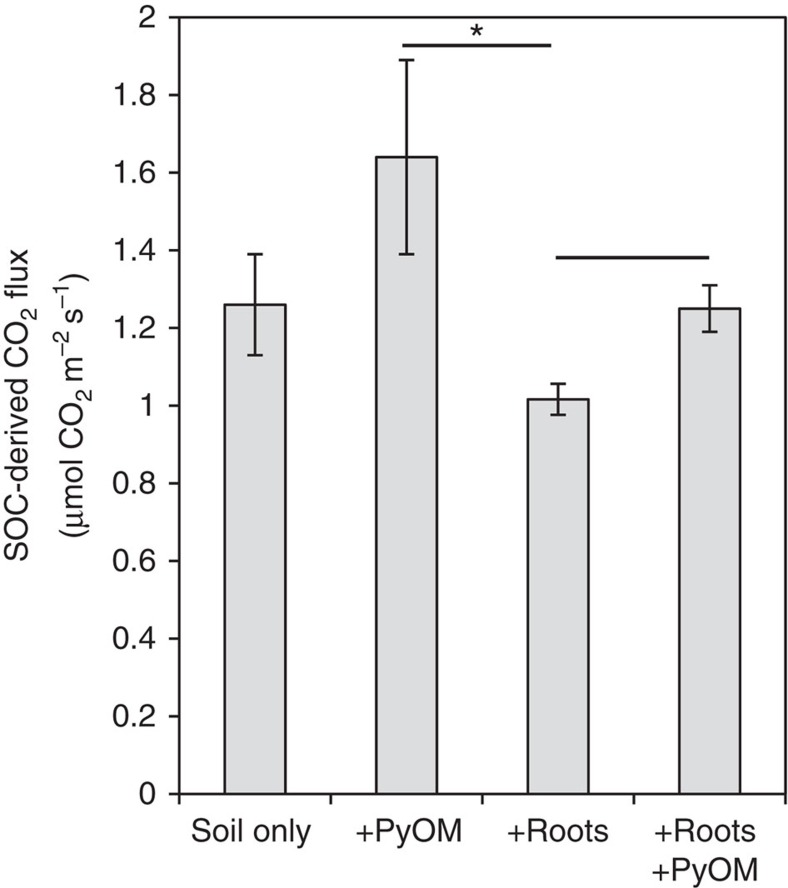
Figure 2. CO2 fluxes from soil organic carbon.
Data shown for one-, two- and three-source systems for one time point (day 66) of the field trial. Error bars±s.e.m., n=7. *A significant difference (P<0.05) in SOC-derived fluxes from plots with roots versus plots with PyOM and roots present. ·Difference (P<0.08) in SOC-derived fluxes from plots with roots versus plots with PyOM.

