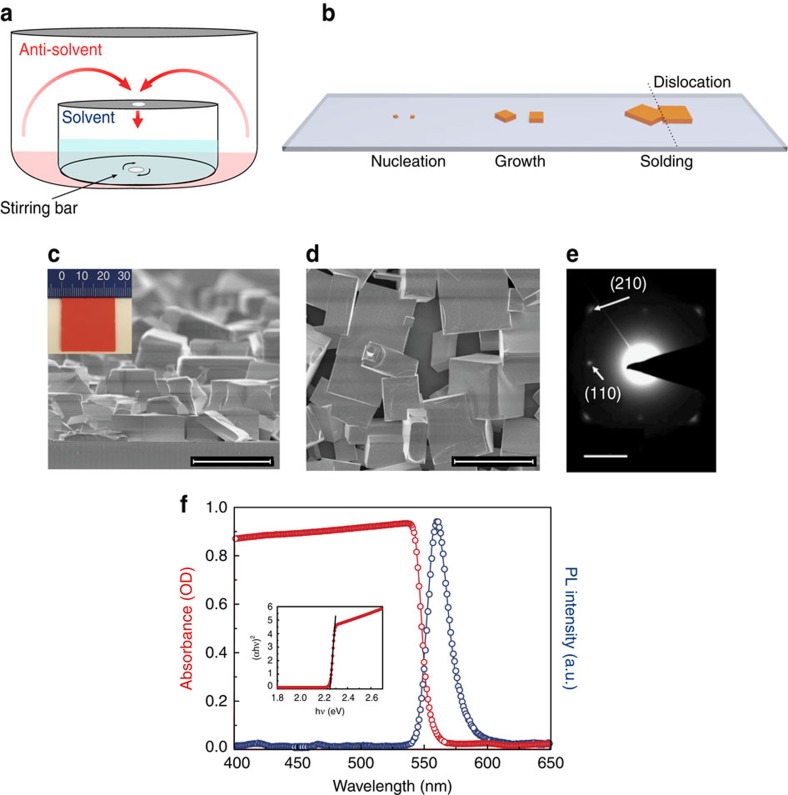
Figure 1. Film growth and characterization.
(a) Schematic of the experimental procedure: a large, sealed crystallizing dish filled with antisolvent is used to host a smaller dish containing the solution. A stirring bar is placed in the inner dish. (b) Kinetics of ISC perovskite growth: after the initial nucleation, the crystals grow until they reach each other and merge to form a continuous solid. At the interface, the lattice continuity is lost, producing one or multiple dislocations. (c) Top view and (d) cross-sectional SEM of the ISC perovskite film. The scale bar identifies a length of 50 μm. (e) Electron diffraction measurements, the scale bar identifies a unit of 2 nm−1. (f) Steady-state photoluminescence and absorption. Inset: calculation of the optical bandgap using the Tauc method. The optical bandgap is measured to be Eg=2.24 eV.

