
Fig. 4.
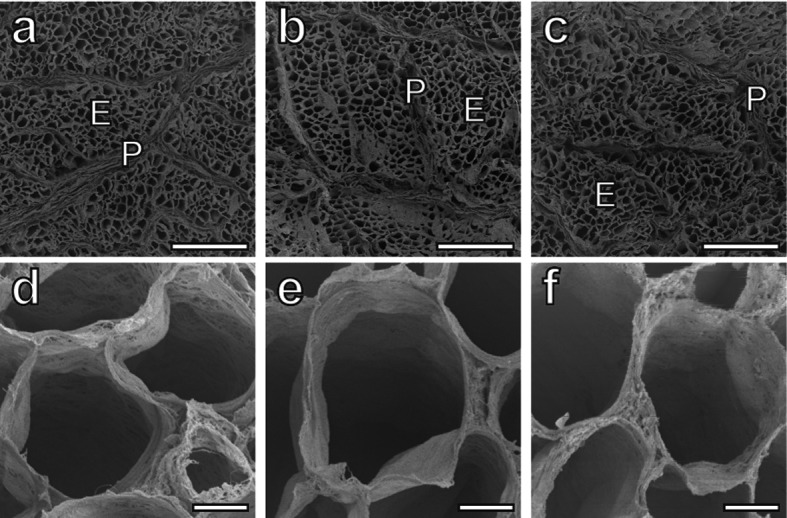
(a–c) Low-magnification SEM photographs of the perimysium (P) around the primary myofiber fascicle and the endomysium (E) of ITL muscles from the control (a), 0.15% Col-Pep (b) and 0.3% Col-Pep (c) groups. Bars=500 µm. (d–f) High-magnification SEM photographs of the endomysium wall of ITL muscles from the control (d), 0.15% Col-Pep (e) and 0.3% Col-Pep (f) groups. Bars=20 µm.