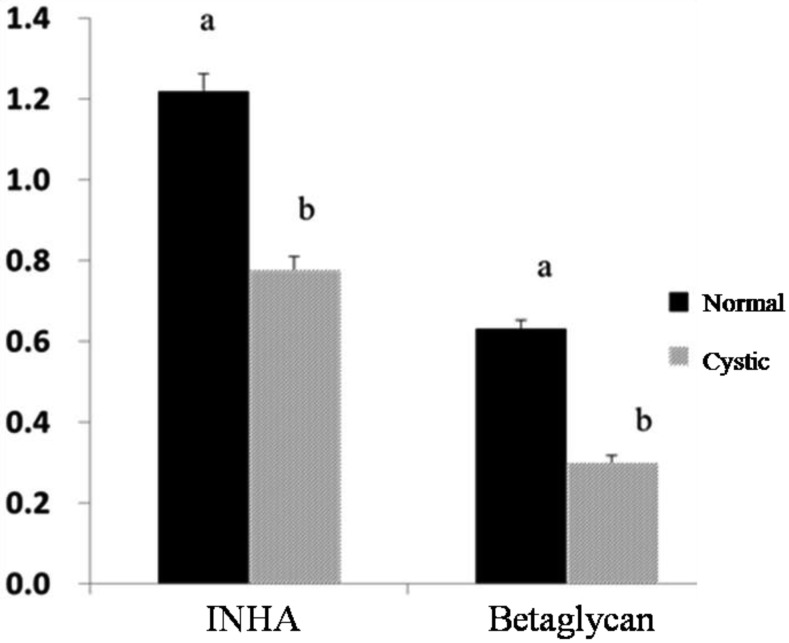
Fig. 2.
Analysis of INHA and betaglycan mRNA in cystic follicles (grey) and normal large follicles (dark). The relative mRNA levels of INHA and betaglycan presented in the figure were corrected to the level of β-actin gene mRNA. Bars indicate the mean ± SEM inhibin α and betaglycan intensities relative to β-actin protein. Different letters above bars indicate statistically significant differences (P<0.05).

