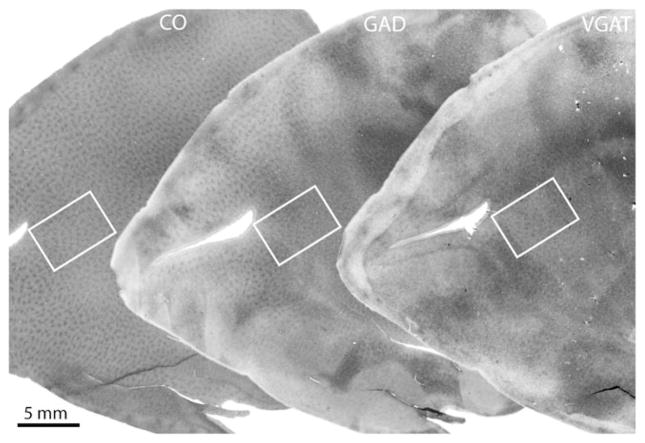
Fig. 2.
Comparison of CO, GAD, and VGAT in macaque striate cortex. The far left section shows the array of CO patches in layer 3. An adjacent section, pictured in the middle, shows a similar appearance of GAD patches. The next section, at the right, shows patches of VGAT. Regions enclosed by the white rectangles are shown in Fig. 3.

