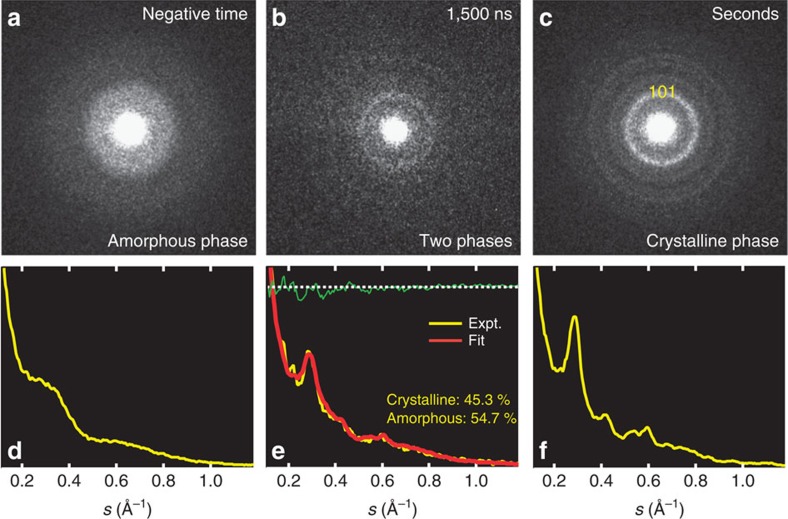
Figure 3. Transient diffraction profiles representing each phase.
(a–f) Diffraction patterns (a–c) and their radially averaged profiles showing three phases at negative, intermediate and final times, which are obtained from the same area of irradiation (d–f). For a typical transient-frame diffraction (b,e), a linear combination of both diffractions at negative time and at seconds was used to represent the proportion of each contribution, as indicated in yellow. Our theoretical assignment and fit of the diffraction (101) is entirely consistent with TiO2 structure: 1/s=3.517 Å. Expt., experimental.

