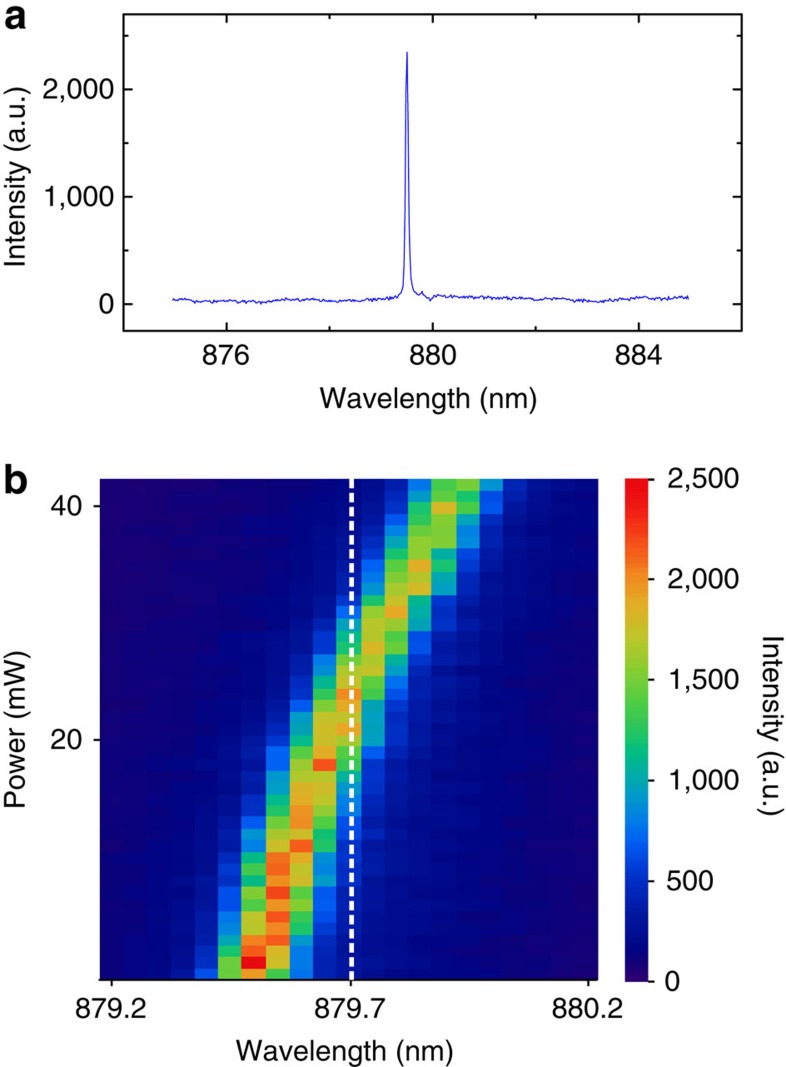
Figure 2. Photoluminescence spectra.
(a) Photoluminescence spectrum without local heating. A single peak appears at the position of 879.5 nm, which may be caused by the unbalanced carrier capture and the filtering effect of the DBR microcavity (see Supplementary Note 2 for the explanations). The wavelength of this peak is a little shorter than that of the memory band (879.7 nm), which provides the chance to tune it to match the memory band using a local-heating effect. (b) Power-dependent spectra. The x axis is the wavelength of QD emission, and the y axis is the power of the 910-nm laser, which is used for local heating. The colour represents the photoluminescence intensity of the QD emission. The peak is shifted across 879.7 nm with increasing laser power. When the power reaches 24 mW, the emission line matches the memory band.

