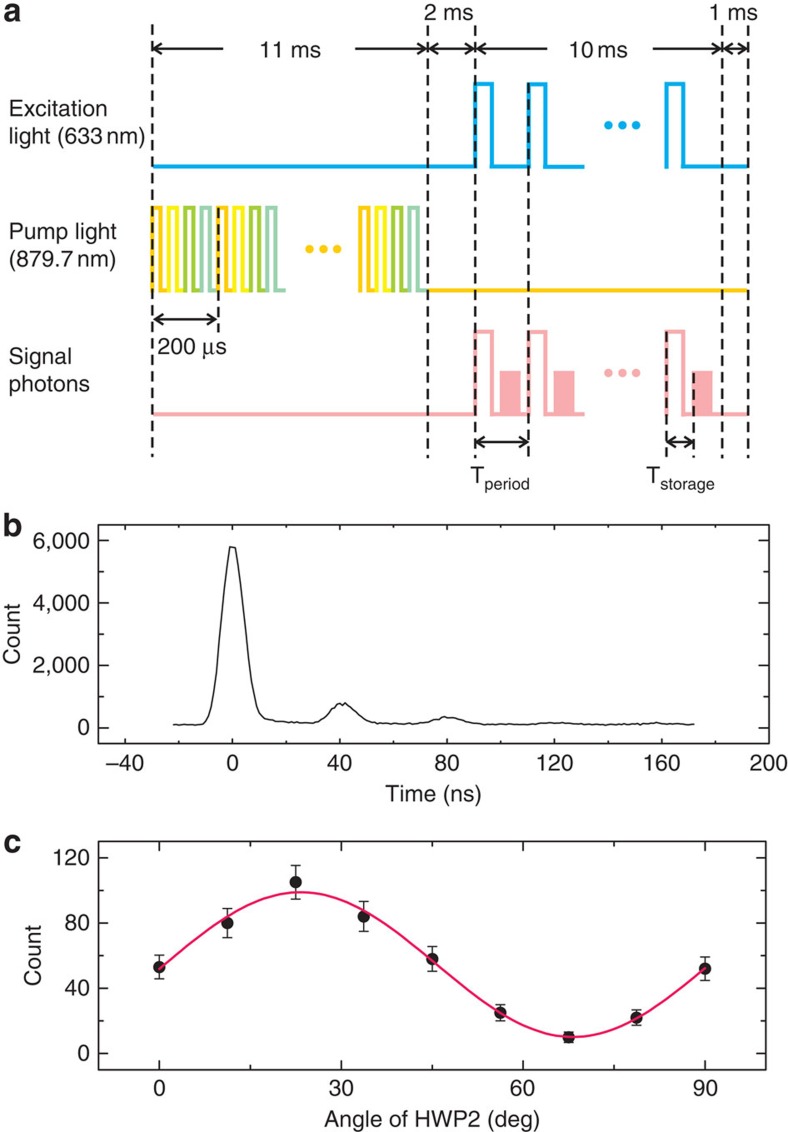
Figure 3. Time sequence and experimental results.
(a) Time sequence diagram. The entire procedure includes a 11.5-ms preparation time, a 2.5-ms wait time, a 10-ms storage and retrieval time and another 1-ms wait time. During the preparation time, the pump pulses with different frequencies (represented by different colours) are used to pump the Nd3+:YVO4 crystals to prepare the AFC (see Supplementary Note 4 for methodological details). In the storage and retrieval procedure, the pump laser is blocked, and then the excitation light associated with the single photons is modulated to a series of pulses with a period of Tperiod. After a storage time Tstorage, the signal photons are retrieved. (b) Time spectrum of the stored single photons. The storage time is 40 ns, and the pulsewidth of the excitation light is 10 ns. The first peak represents the light that is not absorbed. The second peak represents the retrieved single photons, and the third peak is the second-order retrieved photons. (c) Polarization-qubit quantum memory. Single photons are encoded with a qubit |H〉+|V〉 and then sent to the quantum memory. The storage time is 40, and a 2-ns coincidence window is chosen for the retrieved single photons. The retrieved qubit is projected to a series of bases, which are represented by the angles of HWP2. The count shows a sinusoidal oscillation with a fidelity of 0.913±0.026. The error bars in these data are due to the counting statistics, namely, the standard deviation.

