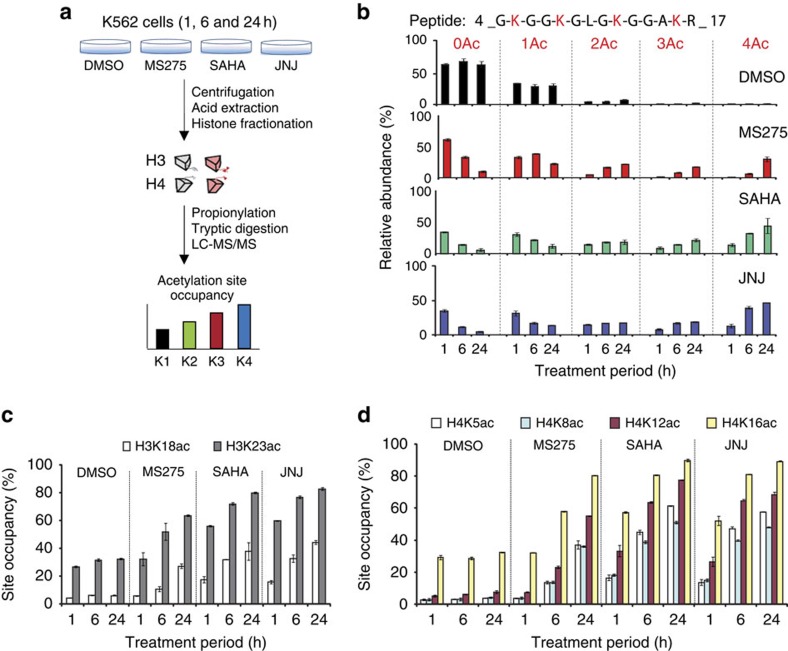
Figure 2. Analysis of acetylation site occupancies in histones H3 and H4 following HDACi treatment.
(a) Histone isolation and MS analysis workflow. Total histones were isolated from human erythroleukemic (K562) cells treated for 1, 6 or 24 h with DMSO (control) or with the HDACi MS-275, SAHA and JNJ-26481585. Total histones were fractionated into individual core histones via offline RP-HPLC. Fractions containing histones H3 and H4 were subjected to propionylation, tryptic digestion and LC–MS/MS analysis. Acetylation site occupancy for each lysine residue was determined based on Iso-PeptidAce reported peptide intensities. (b) Relative abundance of unmodified (0Ac), mono- (1Ac), di- (2Ac), tri- (3Ac) and tetra-acetylated (Ac) peptide 4-GKGGKGLGKGGAKR-17 before (DMSO) or after treatment with MS-275, SAHA or JNJ-26481585. (c) Acetylation site occupancies of histone H3 at positions K18 and K23 and (d) histone H4 at positions K5, K8, K12 and K16. Each bar graph represents the mean of two technical replicates with error bars showing the relative distance from the mean of the maximum and minimum values.

