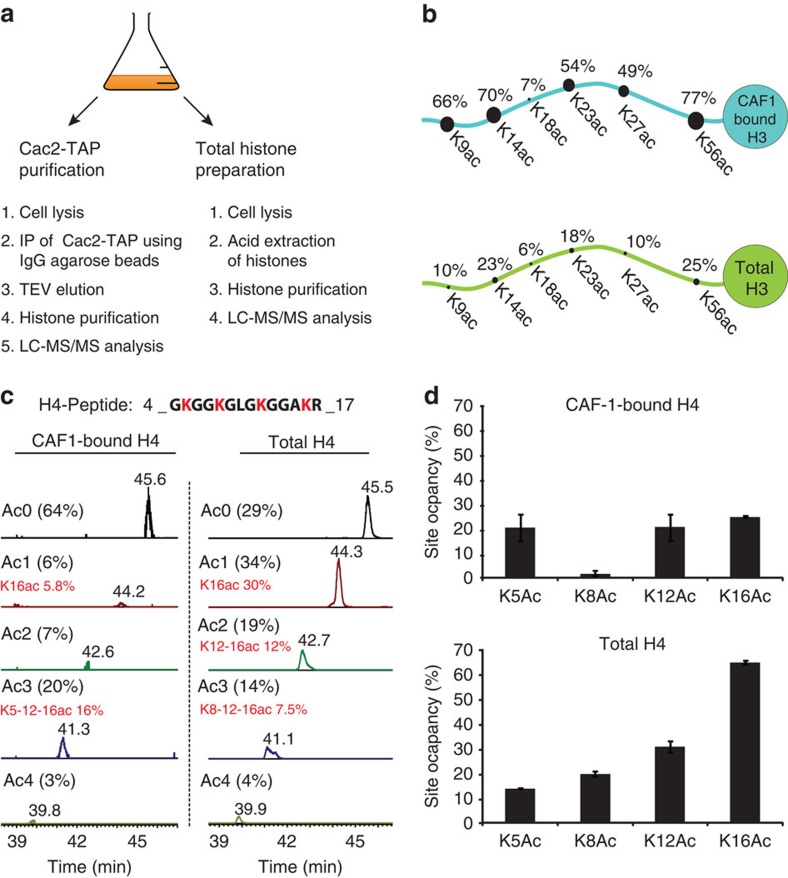
Figure 3. Analysis of acetylation site occupancies in CAF1 associated histones H3 and H4.
(a) Schematic representation of the experimental workflow. Cac2-TAP was purified from 3.5 l of yeast cell culture and the remainder (0.5 l) was processed for total histone preparation. Histones from both samples were fractionated by offline RP-HPLC and analysed by LC–MS/MS. (b) Comparison of lysine acetylation site occupancies in total histone H3 (lower panel) and CAF1-bound H3 (upper panel). (c) Extracted ion chromatograms of histone H4 peptide 4-GKGGKGLGKGGAKR-17 acetylated at zero (Ac0), one (Ac1), two (Ac2), three (Ac3) or four (Ac4) lysine residues in CAF1-bound (left panel) or total histones (right panel). The predominant acetylation pattern in each group of isomers is highlighted in red. (d) Comparison of acetylation site occupancies at positions H4K5, H4K8, H4K12 and H4K16 in CAF1-bound H4 (upper panel) and total histone H4 (lower panel). Each bar graph represents the mean of two technical replicates with error bars showing the relative distance from the mean of the maximum and minimum values.

