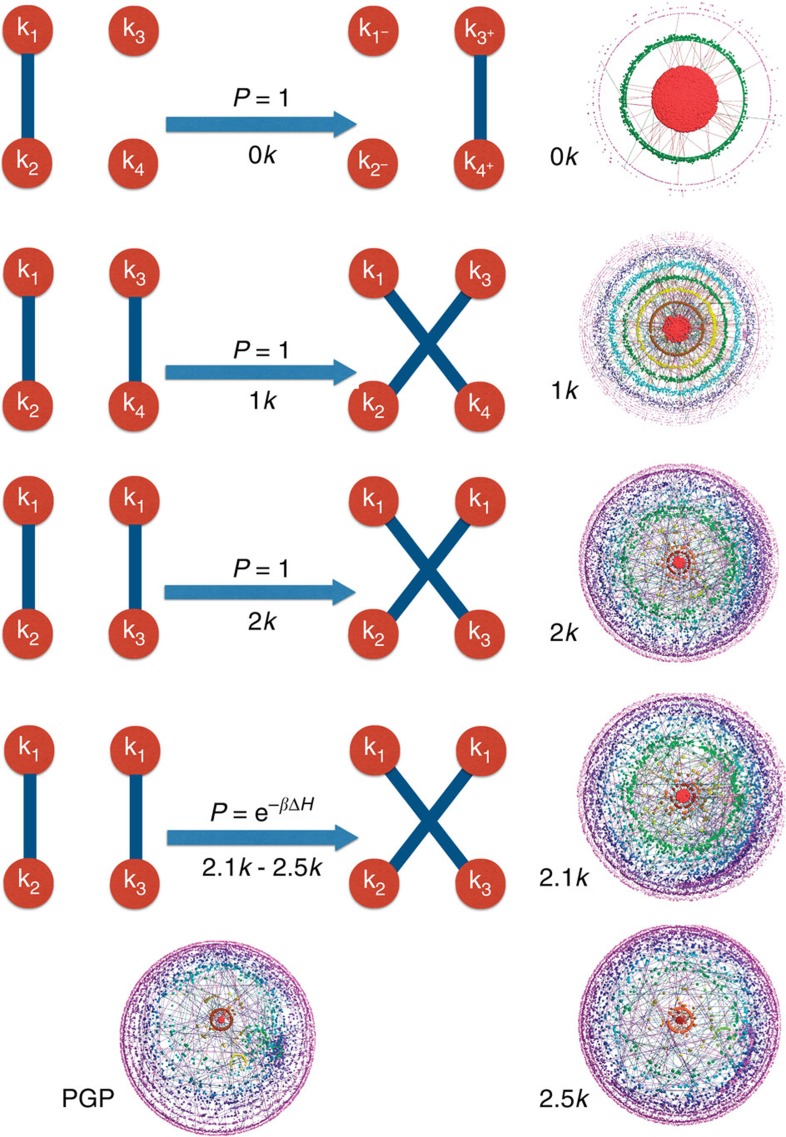
Figure 2. The dk-sampling and convergence of dk-series illustrated.
The left column shows the elementary swaps of dk-randomizing (for d=0, 1, 2) and dk-targeting (for d=2.1, 2.5) rewiring. The nodes are labelled by their degrees, and the arrows are labelled by the rewiring acceptance probability. In dk-randomizing rewiring, random (pairs of) edges are rewired preserving the graph's dk-distribution (and consequently its d′K-distributions for all d′<d). In 2.1k- and 2.5k-targeting rewiring, the moves preserve the 2k-distribution, but each move is accepted with probability p designed to drive the graph closer to a target value of average clustering  (2.1k) or degree-dependent clustering (k) (2.5k): p=min(1, e−βΔH), where β the inverse temperature of this simulated annealing process, ΔH=Ha−Hb, and Ha,b are the distances, after and before the move, between the current and target values of clustering:
  and
and  . The right column shows LaNet-vi (ref. 65) visualizations of the results of these dk-rewiring processes (Supplementary Methods), applied to the PGP network, visualized at the bottom of the left column. The node sizes are proportional to the logarithm of their degrees, while the colour reflects node coreness65. As d grows, the shown dk-random graphs quickly become more similar to the real PGP network.

