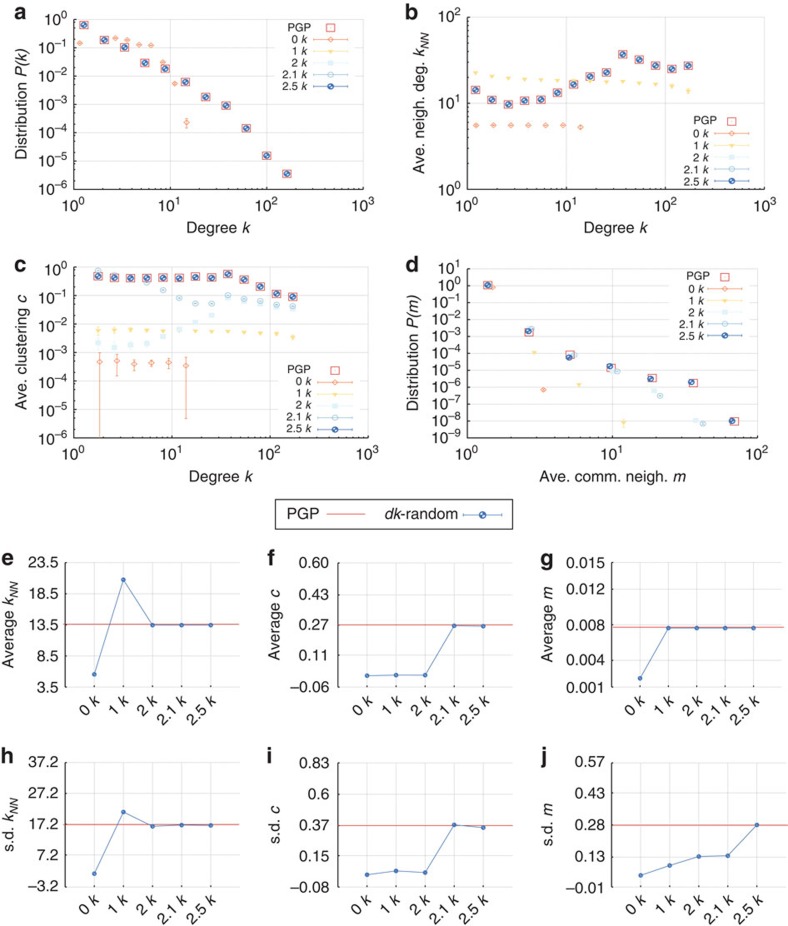
Figure 3. Microscopic properties of the PGP network and its dk-random graphs.
(a) The degree distribution P(k), (b) average degree  of nearest neighbours of nodes of degree k, (c) average clustering
  of nodes of degree k, (d) the distribution P(m) of the number m of common neighbours between all connected pairs of nodes, and (e–g) the means and (h–j) s.d. of the corresponding distributions. The error bars indicate the s.d. of the metrics across different graph realizations.

