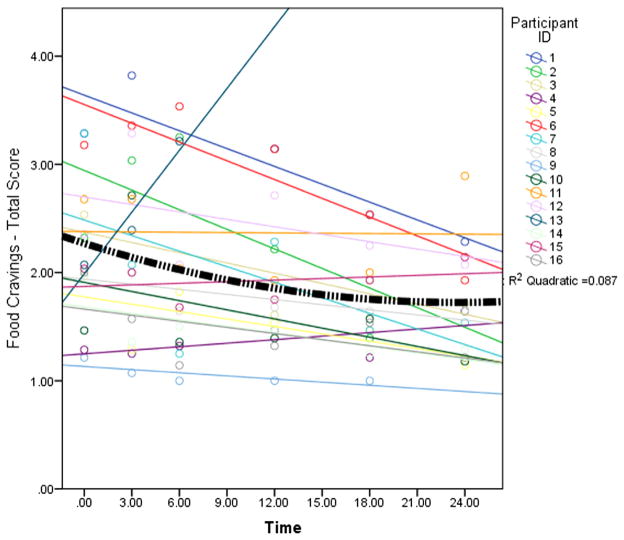
Fig. 1.
Individual food cravings scores (circles), the individual regression lines (straight lines), and the overall non-linear effect of time on total food cravings for the sample (thick black dashed line). Note: Frequency of food cravings measured at baseline, 3 months, 6 months, 12 months, 18 months, and 24 months postoperatively.

