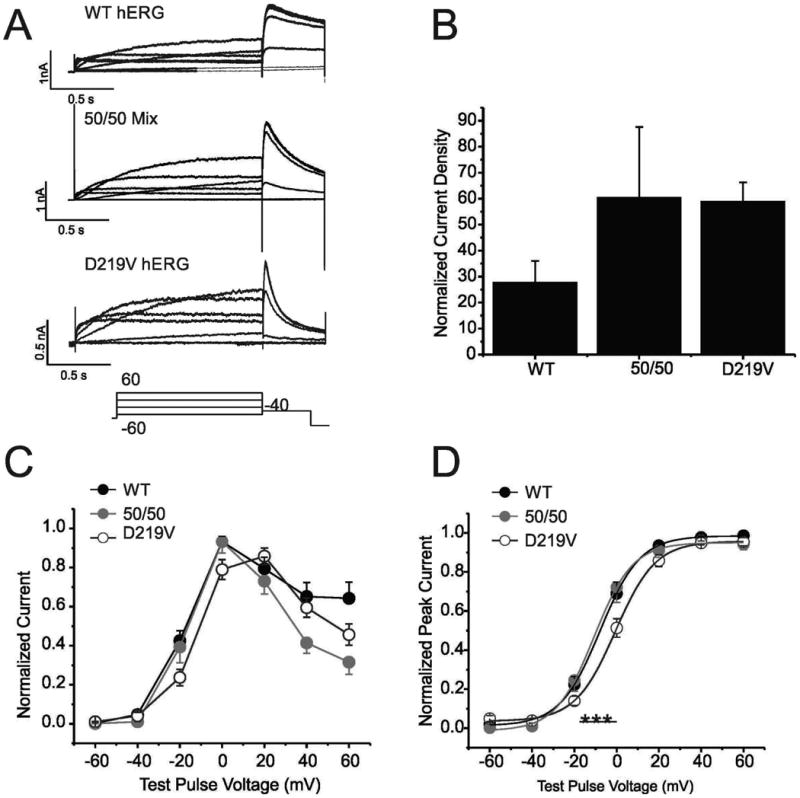
Figure 3. Effect of p.Asp219Val mutation on hERG channel activation.

A) Traces are families of whole cell K+ currents from cells expressing the indicated cDNAs in response to a series of depolarizing steps (Voltage clamp protocol is illustrated below). HEK 293 cells were transiently transfected with WT hERG, a 50/50 mix of WT and p.Asp219Val hERG, and p.Asp219Val hERG alone. 9, 8 and 32 cells respectively were sampled. B) Histogram demonstrates summary of current density for each of the samples. Current density was measured at peak amplitude at the -40 tail current/cell capacitance. There is no significant difference between these current densities. C). Graph shows the current-voltage relationship of WT, 50/50 mix and p.Asp219Val. Measurements were taken at the end of the depolarizing phase. D) Normalized voltage-dependent activation curves are shown for all 3 samples. Curves were fitted using a Boltzman function. V½ for WT hERG was -7.83±0.2mV, 50/50 mix was -10.6±0.68mV and p.Asp219Val hERG was -0.57±0.47mV. These values were significantly different, with a P value of > 0.001.
