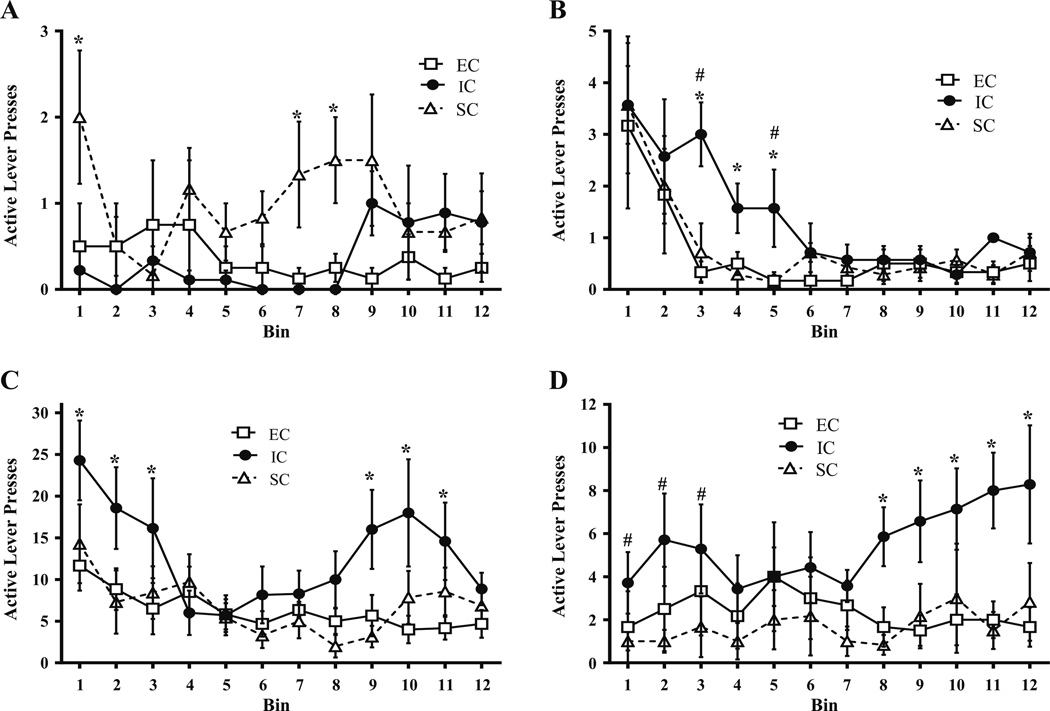
Fig. 2.
Mean ± SEM active lever presses for amphetamine (a 0.03 mg/kg/ infusion; b–d 0.1 mg/kg/infusion) across the 12 5-min bins within the 1-h test session between EC, IC, and SC rats. a FR session (0.03 mg/kg/ infusion) following 3.0 mg/kg MTEP treatment. Asterisks (*) indicate that SC rats exhibited significantly more active lever pressing than IC rats during bins 1, 7, and 8. b FR session (0.1 mg/kg/infusion) following 3.0 mg/kg MTEP treatment. Pound signs (#) indicate that IC rats exhibited significantly more active lever pressing than EC rats during bins 3 and 5. Asterisks (*) indicate that IC rats exhibited significantly more active lever pressing than SC rats during bins 3, 4, and 5. c PR session (0.1 mg/kg/infusion) following saline treatment. Asterisks (*) indicate that IC rats exhibited significantly more active lever responses than both SC and EC rats. d PR session (0.1 mg/kg/infusion) following 3.0 mg/kg MTEP. Asterisks (*) indicate IC rats exhibiting significantly more active lever responses than both SC and EC rats. Pound signs (#) indicate IC rats exhibiting more active lever responses than SC rats. (all p<.05).

