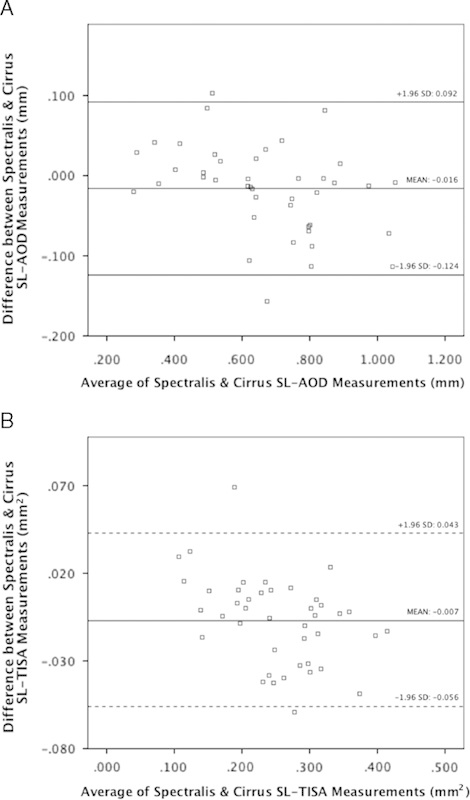
FIGURE 1.

A and B, Bland-Altman plots demonstrate interinstrument reproducibility for SL-AOD and SL-TISA. The horizontal lines indicate the mean difference (solid line) and the limits of agreement (dotted lines). AOD indicates angle opening distance; SL, Schwalbe line; TISA, trabecular iris space area.
