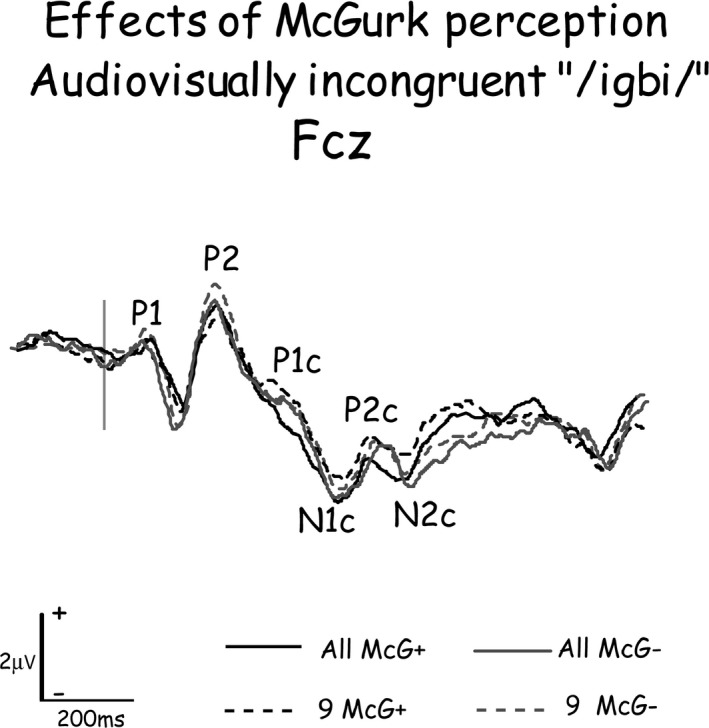
Figure 2.

Event‐related potential waveforms recorded from FCz to the same audio‐visually incongruent stimulus when it evoked a McGurk perception (McG+) and when it failed to evoke it (McG−), when grand‐averaged from all 20 subjects or from the nine subjects that were used for analyzing the effects of McGurk perception on brain activity. The constituent peaks of the waveforms are marked by their name. The P1 to P2 complex of components were evoked by stimulus onset, while P1c to N2c are the potentials evoked by the consonant. Note the similarity of waveforms grand averaged from all subjects and from the subset of nine subjects.
