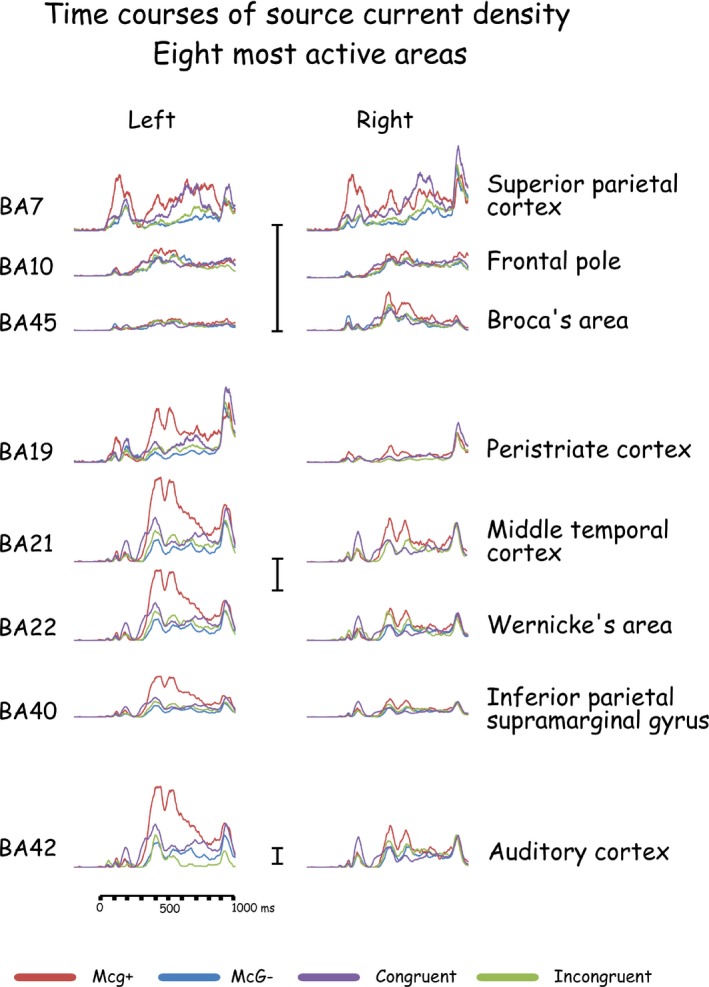
Figure 3.

Time courses of current density in the eight most active brain areas in response to congruent and incongruent audio‐visual stimuli with full articulation. Current densities when the McGurk effect to the same incongruent stimuli was evident and when it was not are also presented. The vertical current density scales represent 1 mAmp/mm2.
