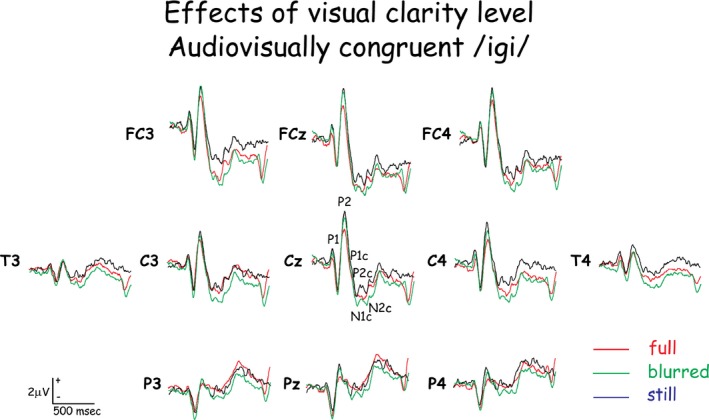
Figure 4.

The potentials evoked on the scalp of all subjects in response to the first stimulus in the pair in response to audio‐visually congruent stimuli with three levels of visual articulation clarity. Note the similarity of waveforms in the response to stimulus onset (P1 to P2) and the differences in waveforms to the consonant (P1c to N2c).
