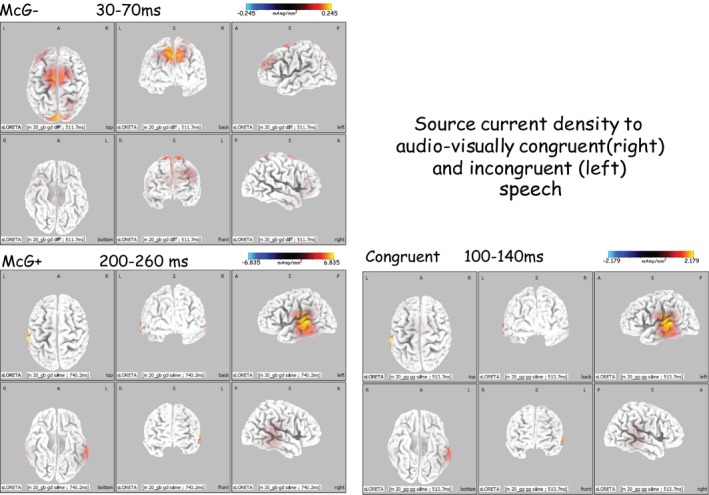
Figure 6.

Source current density distributions to audiovisually congruent stimulus and to the same incongruent stimuli when they evoked a McGurk percept (McG+) and when they did not (McG−), at three time periods following consonant onset. Note the large number of significantly active brain areas in the initial period of 30–70 msec from consonant onset. Also note the similar distributions in response to congruent audiovisual stimuli and, a little later, to incongruent stimuli that resulted in McGurk perception.
