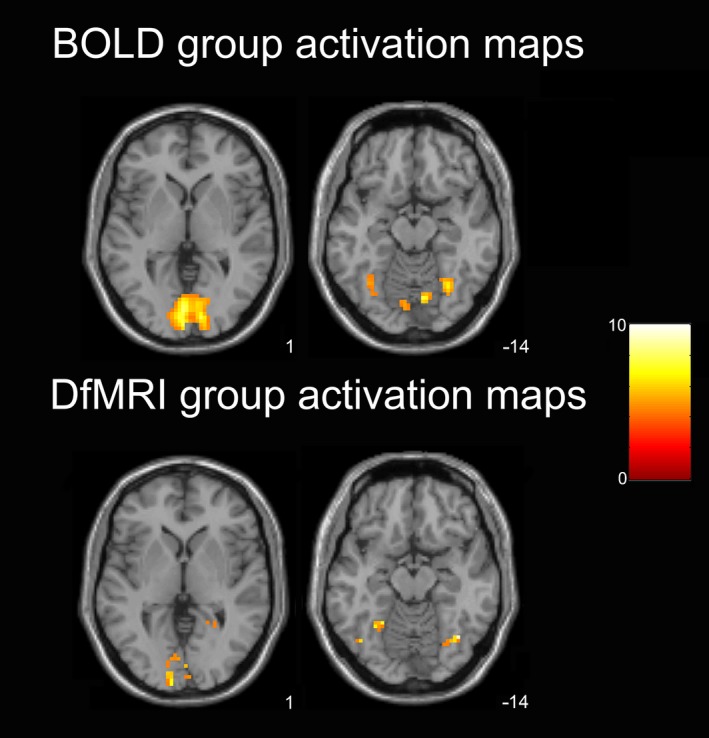
Figure 2.

One‐sample t‐test activation maps showing group activation for the color Mondrian condition. Axial slices shown at peak voxel level for BOLD (z = 1) and DfMRI (z = −14). SPMs thresholded at P < 0.001 uncorrected for multiple comparisons and overlaid into MNI T1‐weighted template image. Color bar indicates t‐values.
