
Figure 5.
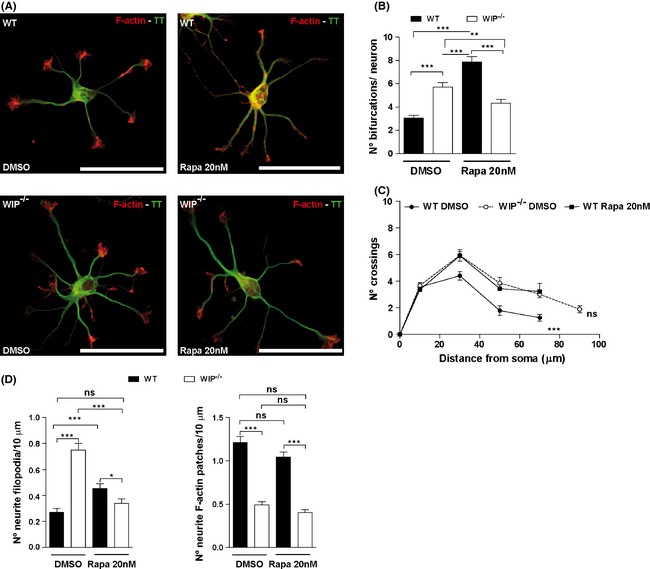
Rapacymin inhibition of mTOR in WT neurons phenotypically mimics WIP −/− neuritic complexity. Primary neurons from WT or WIP −/− murine embryos were dissociated and cultured with vehicle (DMSO), or with rapamycin (20 nM). (A) Representative images of rapamycin‐treated neurons fixed at 24 h postplating and co‐labeled with TRITC‐phalloidin (F‐actin, red) and Alexa488‐anti‐ α‐tyrosinated tubulin (TT, green). Scale bar, 50 μm. (B) Average number of bifurcations per neuron, alone or rapamycin‐treated. n = 100 neurons analyzed per experimental group from two independent experiments. **P < 0.01; ***P < 0.001 (Student's t‐test). (C) Sholl analysis of traced neurons, after indicated treatments of WT and WIP −/− cells. The quantification shows higher number of crossings in WIP −/− neurons compared to WT cells before treatment. After rapamycin treatment, WT neurons show similar number of crossings that WIP −/− neurons before treatment. n = 30 neurons analyzed per experimental group from three independent experiments. ***P < 0.001 (WIP −/− neurons compared to WT cells before treatment); ns, not significant (rapamycin‐treated WT neurons compared to DMSO‐treated WIP −/− cells) (Two‐way ANOVA). (D) Quantification of neuritic filopodia and F‐actin patches per 10 μm in WT and WIP −/− neurons. Data for 350 filopodia and 355 F‐actin patches, n = 40 neurons analyzed per experimental group from three independent experiments. *P < 0.05, ***P < 0.001; ns, not significant (Student's t‐test).