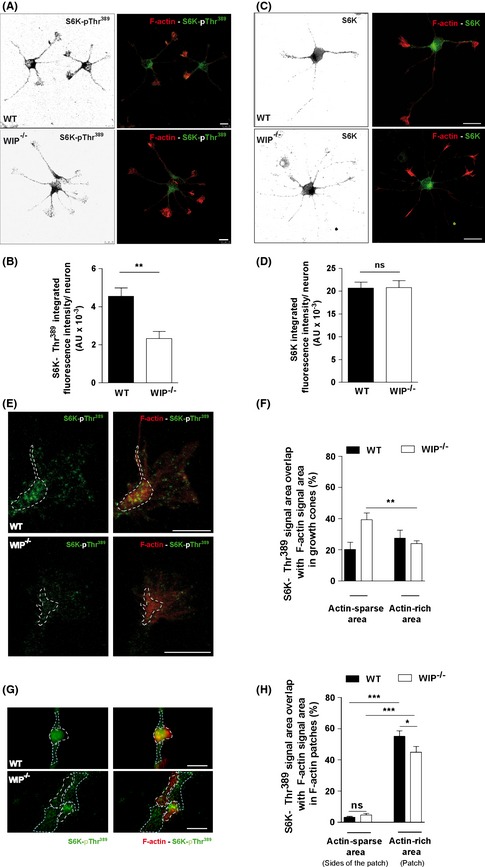
Figure 6.

Subcellular S6K‐pThr389 distribution is modified in WIP −/− neurons. Representative images of hippocampal neurons from WT and WIP −/− murine embryos seeded on PLL‐coated coverslips (24 h), fixed and stained with TRITC‐phalloidin (F‐actin, red) and Alexa488‐anti‐S6K‐pThr389 (green) (A) or Alexa488‐anti‐S6K (green) (C). Scale bar, 10 μm for both. Quantification of integrated fluorescence intensity of S6K‐pThr389 (B) and anti‐S6K (D) for control and WIP −/− neurons. (E) Representative images of neuron growth cones obtained following the experimental design described for Fig. 5A and C. Scale bar, 5 μm. (F) Quantification of the spatial overlap of Alexa488‐anti‐S6K‐pThr389 signal on TRITC‐phalloidin signal in actin‐sparse or ‐rich (dotted outline) areas. n = 12 growth cones per genotype, from two independent experiments. Student's t‐test; **P < 0.01. (G) Representative images of neuritic F‐actin patches acquired following the experimental design described for Fig. 5A and C. Scale bar, 1 μm. (H) Quantification of the spatial overlap of Alexa488‐anti‐S6K‐pThr389 signal on TRITC‐phalloidin signal in actin‐sparse (light blue dotted outline) or ‐rich (white dotted outline) areas. n = 60 F‐actin patches or average of either side of them per genotype, from two independent experiments. *P < 0.05; ***P < 0.001 (Student's t‐test).
