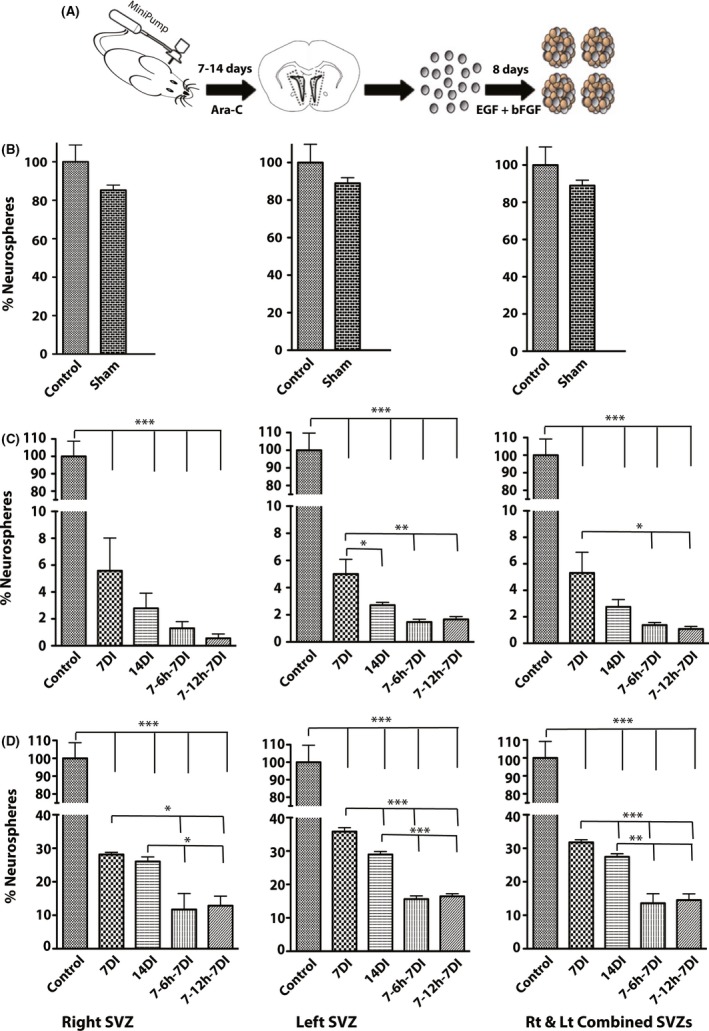
Figure 1.

Study design, neurosphere assay and comparing the number of neurospheres in different Ara‐C kill paradigms (A–D). A: Schematic diagram showing the study design and the neurosphere assay. B: Relative number of neurospheres per right, left and combined subventricular zone (SVZ) tissue in control and sham (saline infused) groups. No statistically significant difference was observed. C: Relative number of neurospheres per right, left and combined SVZ tissue in control versus different Ara‐C kill paradigms immediately after completion of Ara‐C infusion. As evident, neurosphere formations reduced significantly in all Ara‐C kill paradigms comparing to the control group (***P < 0.0001). This reduction was significantly higher in 14 days, 7‐6 h‐7, and 7‐12 h‐7 infusion paradigms (**P < 0.001, *P < 0.05) comparing to 7 days infusion paradigm. D: Relative number of neurospheres per right, left, and combined SVZ tissue in control versus different Ara‐C kill paradigms 1 week after completion of Ara‐C infusion. Interestingly, neurosphere formation frequency increased to 10–30% of control value but still is significantly lower in all Ara‐C groups comparing to the control group (***P < 0.0001). 14 days, 7‐6 h‐7, and 7‐12 h‐7 infusion paradigms resulted in a more pronounced reduction (***P < 0.0001, **P < 0.001, *P < 0.05) as compared to the 7 days infusion paradigm. All values are mean ± SEM relative to control. N = 3 independent experiments.
