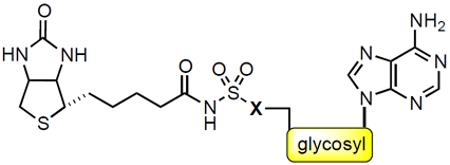
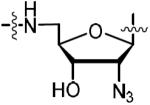
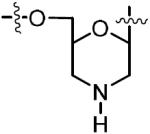
Table 1.
MIC90 and thermodynamic data of biotinylated nucleosides. 
| Compound | MIC90, μMb | KD, nMa | ΔG, kcal/mola | ΔH, kcal/mola | -TΔS, kcal/mol | ΔTm, °C | PDB | |
|---|---|---|---|---|---|---|---|---|
| 14, Bio-AMS |

|
0.78 | 0.865 ± 0.040 | −12.4 ± 0.5 | −18.9 ± 0.1 | 6.6 ± 0.1 | 14.5 ± 1.0 | 3rux |
| 28 |

|
>100 | 0.753 ± 0.002 | −12.4 ± 0.0 | −20.2 ± 0.2 | 7.8 ± 0.2 | 12.2 ± 1.0 | n.d.c |
| 34 |

|
3.12 | 2.14 ± 0.08 | −11.8 ± 0.2 | −22.1 ± 0.2 | 10.3 ± 0.2 | 12.5 ± 0.5 | n.d.c |
| 36 |

|
1.56 | 0.540 ± 0.007 | −12.6 ± 0.2 | −23.5 ± 0.4 | 10.7 ± 0.4 | 14.5 ± 1.0 | 4xtv |
| 46 |

|
3.12 | 0.933 ± 0.045 | −12.3 ± 0.6 | −23.2 ± 0.2 | 10.9 ± 0.3 | 13.0 ± 0.5 | 4xyw |
| 47 |

|
1.25 | 0.627 ± 0.016 | −12.6 ± 1.0 | −19.1 ± 0.1 | 6.5 ± 0.2 | 19.2 ± 0.6 | n.d.c |
| 57 |

|
>100 | 0.027 ± 0.003 | −14.4 ± 0.2 | –29.3 ± 0.1 | 14.9 ± 0.1 | 17.0 ± 1.0 | 4xtx |
| 63 |

|
1.25 | 0.614 ± 0.018 | −12.6 ± 0.3 | −24.3 ± 0.5 | 11.8 ± 0.5 | 15.2 ± 0.8 | 4xty |
| 69 |

|
50.0 | 0.153 ± 0.000 | −13.4 ± 0.0 | −28.4 ± 0.6 | 14.7 ± 0.5 | 17.7 ± 0.8 | 4xtz |
| 73 |

|
50.0 | 0.769 ± 0.006 | −12.4 ± 0.4 | −20.3 ± 0.4 | 8.1 ± 0.5 | 14.2 ± 0.3 | 4xu0 |
| 82 |

|
3.12 | 0.324 ± 0.023 | −12.9 ± 0.9 | −18.8 ± 0.0 | 5.9 ± 0.1 | 13.8 ± 0.8 | 4xu1 |
| 87 |

|
0.78 | 0.592 ± 0.009 | −12.6 ± 0.1 | −21.4 ± 0.5 | 8.8 ± 0.6 | 15.0 ± 1.0 | 4xu2 |
| 90 |
|
3.12 | 0.315 ± 0.003 | −13.0 ± 0.1 | −25.5 ± 0.7 | 12.6 ± 0.7 | 14.7 ± 0.3 | 4xu3 |
Competitive ITC experiments to determine KD and ΔG were performed at least in triplicate with 2 different enzyme batches while direct titration experiments were done in triplicate. All analogs showed n values of 1 ± 0.2.
Minimum inhibitory concentrations (MIC) that resulted in >90% growth inhibition of M. tuberculosis H37Rv were determined by a broth microdilution assay in GAS medium. Experiments were performed twice independently in triplicate. The MIC is defined as the lowest concentration of inhibitors that prevented growth, as determined by measuring the endpoint OD600 values.
Not determined
