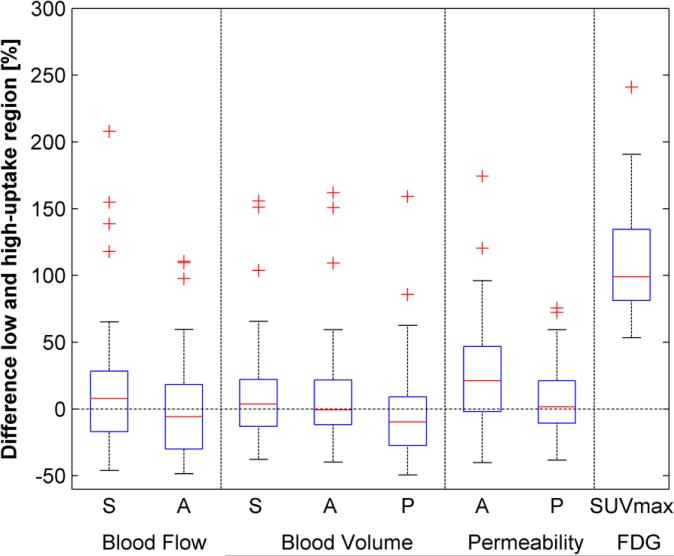
Figure 3.
Box-plot of the differences between the calculated perfusion parameters for the low and high uptake regions inside the primary tumour for the maximum slope (S), deconvolution algorithm (A) and Patlak model (P). Only maximum SUV showed a significant increase of 108% between both regions (p<0.001) due to the definition of the two regions of interest.

