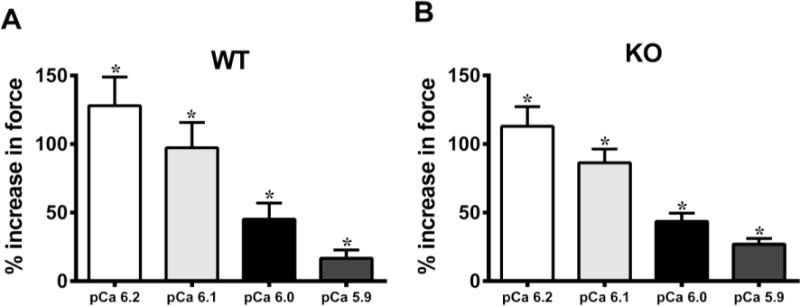
FIGURE 2. Effect of OM on force enhancement at various levels of activator [Ca2+].

Baseline forces generated by the skinned ventricular preparations were first measured in Ca2+ solutions with pCa ranging from 6.2 to 5.9. Forces were again measured on the same preparations using the same range of pCa solutions following 2-minute incubation with OM. The net increase in force generation following incubation with OM at each level of activator [Ca2+] was calculated and is expressed as % increase in force from baseline in (A) WT and (B) KO preparations. Thus, the % increases shown in panels A and B following OM treatment are over and above the Ca2+-mediated force generation, at each pCa. The ability of OM to enhance force production decreases as the level of activator [Ca2+] in the sarcomere increases. No statistical differences were found between the % increases in forces following OM treatment in WT and KO groups. This indicates that OM enhanced force generation in the WT and KO preparations to the same extent. Values are expressed as mean ± S.E.M. Independent t-tests were used to compare the data between WT and KO groups and paired t-tests were used to compare the data between pre- and post-OM treatment with in the same group. 16 preparations were analyzed from 5 WT hearts and 18 preparations were analyzed from 5 KO hearts, with multiple preparations from each heart. * P < 0.05 when comparing forces generated before incubation with OM vs. forces generated following incubation with OM within each group.
