
Figure 8.
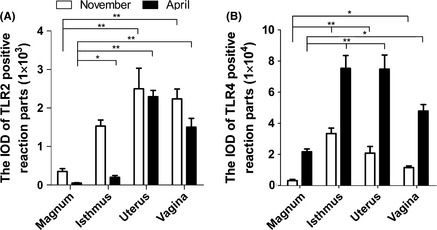
The IOD of TLR2/4 Positive Reaction Parts in Oviduct during Hibernation. (A) Image shows changes in numbers of TLR2‐positive reaction parts in four different parts of oviduct in two different months. (B) The IOD of TLR4‐positive reaction parts in oviduct during hibernation. Data are presented as mean ± SE of five turtles per group. Significant differences are identified as *, P < 0.05; **, P < 0.01.