
Figure 9.
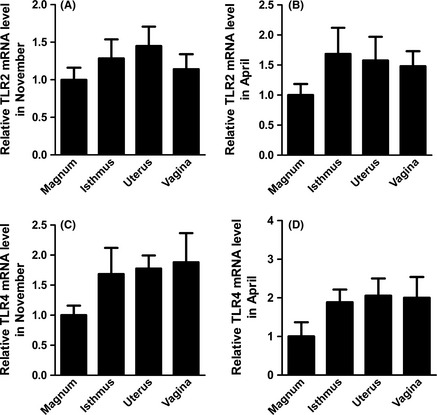
Validation of the Differential Expression of TLR2/4 mRNA Levels in Different Segments of the Turtle Oviduct using qRT‐PCR. The experimental procedure is described in the “Materials and methods.” The graphs show the mean ± SE of five turtles per group (p>0.05).