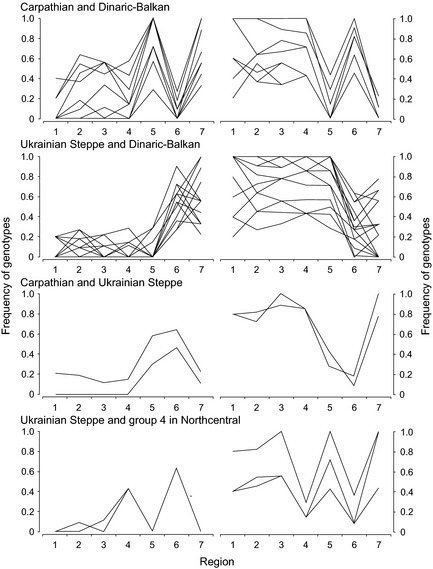
Figure 3.

Spatial distributions of European wolf single nucleotide polymorphism (SNP) loci/genotypes typical for two neighboring clusters. The graphs show frequencies of loci/genotypes differentiating among wolves in northcentral (groups 1–4), Carpathian (5), Ukrainian Steppe (6), and Dinaric‐Balkan clusters (group 7). Numbers on x‐axis are wolf groups 1–7 (see Fig. 1). Left panels: loci/genotypes with high frequencies in the two clusters. Right panels: loci/genotypes with low frequencies in the two clusters. SNP loci and genotypes are listed in Table S4.
