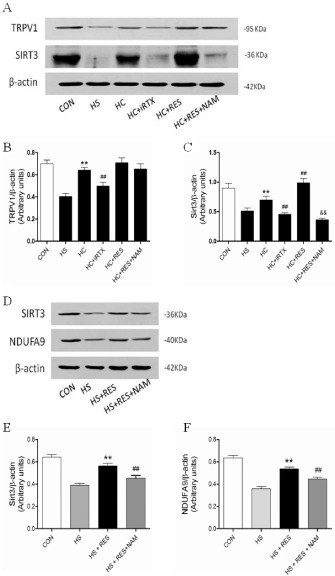
Figure 5.

Changes in sirtuin 3 (SIRT3) and NDUFA9 expression in cultured cardiomyoblasts. (A) Representative blots of TRPV1 and sirtuin 3. (B,C) Quantitative analysis of TRPV1 and sirtuin 3 expression in cultured cardiomyoblasts in the presence of high‐sodium medium with or without TRPV1 and sirtuin 3 agonist and inhibitor treatment for 24 h (n = 5). The results are shown as the means ± SEM (n = 5). **P < 0.01 versus mice on a HS diet; ## P < 0.01 versus mice on a HS diet plus capsaicin; && P < 0.01 versus mice on a HS diet with resveratrol (RES). (D) Representative protein blots of sirtuin 3 and NDUFA9. (E,F) Quantitative analysis of sirtuin 3 and NDUFA9 expression in cultured cardiomyoblasts in the presence of high‐sodium medium with or without sirtuin 3 agonist and inhibitor treatment for 24 h (n = 5). The results are shown as the means ± SEM. (n = 5), **P < 0.01 versus mice on a HS diet; ## P < 0.01 versus mice on a HS diet with RES.
