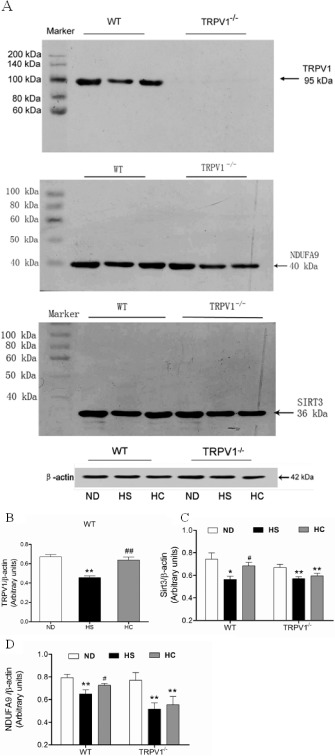
Figure 6.

TRPV1, sirtuin 3 (SIRT3) and NDUFA9 expression in freshly isolated mitochondria from the cardiac tissues of WT and TRPV1 −/− mice. (A) Representative blots of TRPV1, sirtuin 3 and NDUFA9. (B–D) Quantitative analysis of TRPV1, sirtuin 3, NDUFA9 expressions in WT and TRPV1−/− mice fed a HS diet with or without capsaicin treatment. The values are presented as the means ± SEM (n = 5). *P < 0.05, **P < 0.01 versus mice on a ND; # P < 0.05, ## P < 0.01 versus HS diet.
