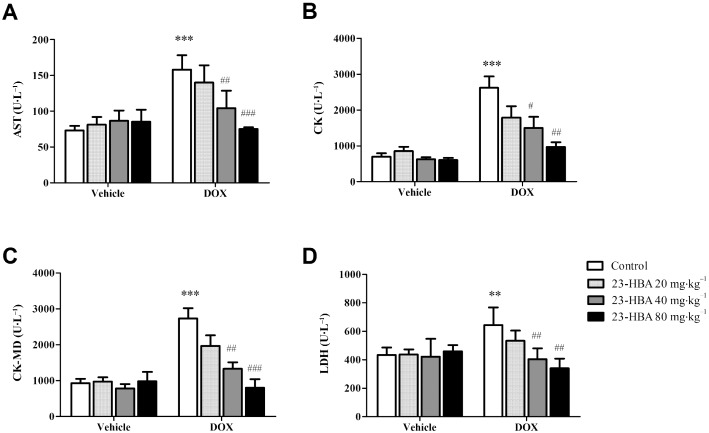
Figure 2.

The concentrations of AST, CK, CK‐MD and LDH in the plasma of mice treated with doxorubicin (DOX, 2 mg·kg−1) and/or 23‐HBA (20, 40, 80 mg·kg−1). Data are presented as mean ± SEM (n = 6). **P < 0.01, ***P < 0.001 versus control group without doxorubicin treatment; # P < 0.05, ## P < 0.01, ### P < 0.001 versus control group with doxorubicin treatment.
