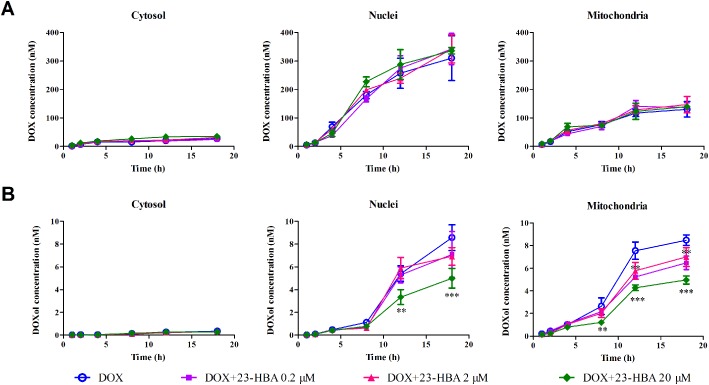
Figure 6.

Time–concentration curves of the subcellular distribution of doxorubicin (A) and doxorubicinol (DOXol) (B) in H9c2 cells obtained with the cell fraction approach. H9c2 cells were incubated with 5 μM doxorubicin in the absence or presence of 0.2, 2.0 and 20.0 μM 23‐HBA for 1, 2, 4, 8, 12 and 18 h. The nuclei, mitochondria and cytosol were separated, and doxorubicin or doxorubicinol concentrations in these subcellular organelles were quantified by LC‐MS/MS. Data are expressed as mean ± SEM. of five independent experiments. **P < 0.01, ***P < 0.001 versus doxorubicin group at the same time.
