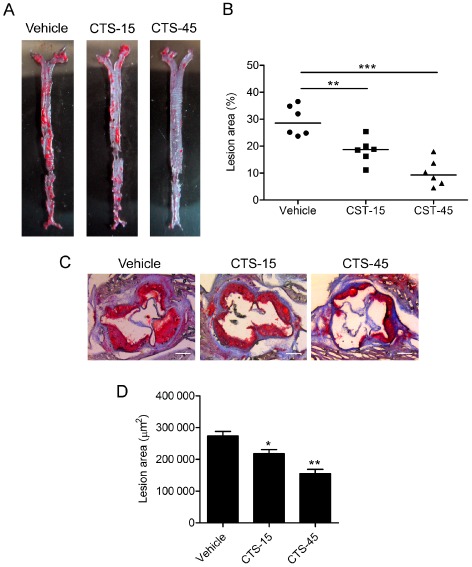
Figure 1.

CTS attenuates atherosclerotic lesion size in ApoE −/− mice. (A) Atherosclerosis in the arterial tree was evaluated by Oil Red O staining. (B) Quantification of Oil Red O‐positive areas in en face aorta by NIH ImageJ software. n = 6 for each group. (C) Representative photomicrographs of Oil Red O staining of the atherosclerotic lesions in the aortic sinus. Original magnification, ×50. (D) Morphometric analysis of atherosclerotic lesion size in aortic sinus. Average sizes of atherosclerotic lesions were calculated from eight sections in ApoE −/− mice fed an atherogenic diet. n = 10 for each group. *P < 0.05, **P < 0.01, ***P < 0.001 compared with vehicle group respectively.
