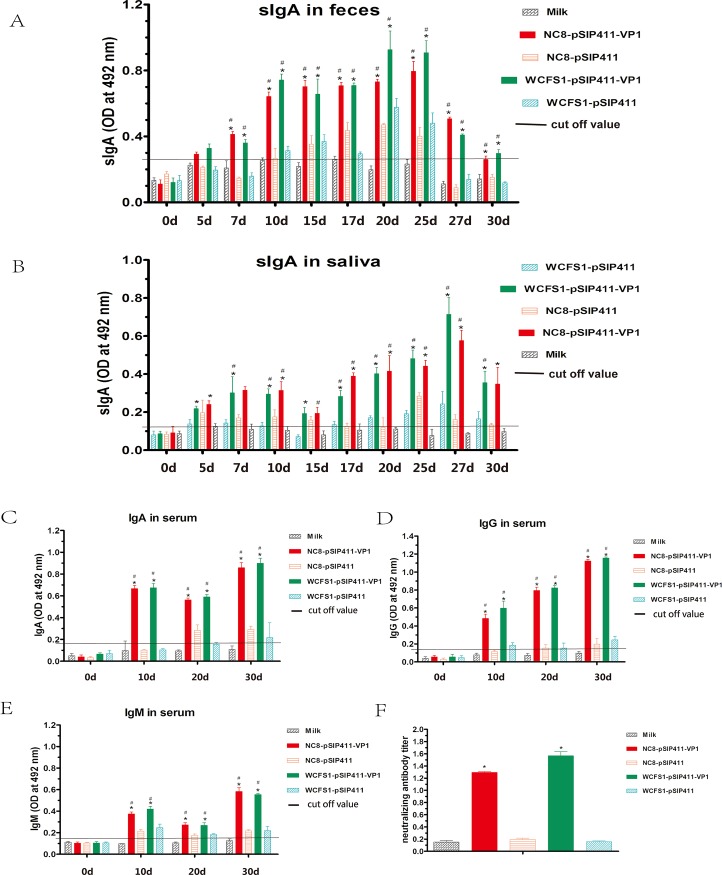
Fig 2. Titers of VP1-specific antibodies and neutralizing antibody.
(A) sIgA antibody in feces detected by capture ELISA on days 0, 5, 7, 10, 15, 17, 20, 25, 27 and 30. (B) sIgA antibody in saliva detected by capture ELISA at 0, 5, 7, 10, 15, 17, 20, 25, 27 and 30d. (C) IgA antibody in serum detected by capture ELISA on days 0, 10, 20 and 30. (D) IgG antibody in serum detected by indirect ELISA on days 0, 10, 20 and 30. (E) IgM antibody in serum detected by capture ELISA on days 0, 10, 20 and 30. (F) Titers of FMDV-specific neutralizing antibodies. Data are expressed as mean of optical density (OD) ± SD (n = 3). “*” stands for statistically significant differences relative to the milk control and “#” represents statistically significant differences relative to the WCFS1/NC8-pSIP411 control (P<0.05). Abbreviations: Ig, immunoglobulin; SD, standard deviations.

