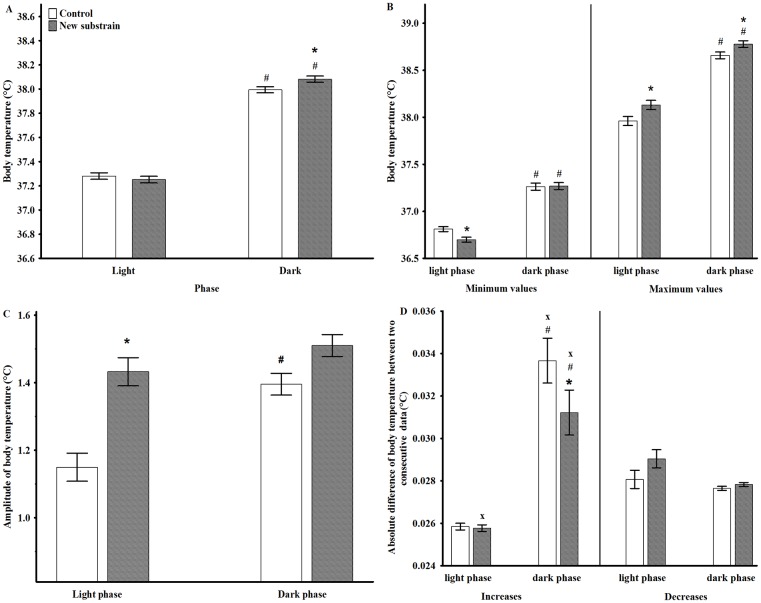
Fig 3. Body temperature parameters in undisturbed circumstances during light and dark phases.
The mean values of BT minimum (A), BT maximum (B), BT amplitudes (C), and the mean of changes in BT between two consecutive data points (D). * p <0.05 between groups; # p <0.05 between the day cycles; x p <0.05 between the BT decreases and increases. Data are presented as means ± SEM.

