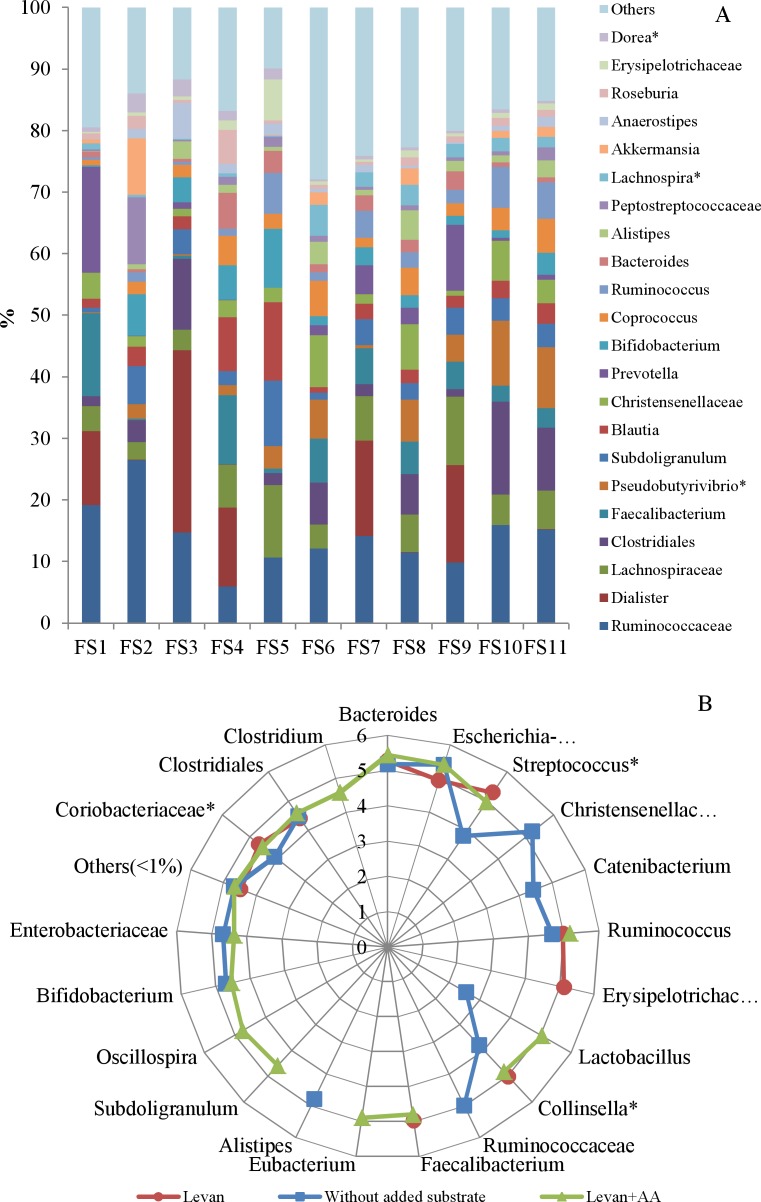
Fig 1. Bacterial taxa in individual fecal samples and their abundance after the growth in microcalorimeter.
(A) 22 bacterial taxa of fecal samples (FS1-11) with average abundance ≥ 1% are shown (sum of reads in relative scale, %). (B) abundance of genera (family/order level if the genus was not identified) per million cells (1 read = 1 cell) after growth on levan (red dots), levan plus amino acids (green triangles) or without added substrates (blue rectangles) in a logarithmic scale. All data points presented as average values of all fecal samples. *—statistical difference between the samples with levan and without added substrates (p-value < 0.05), **—statistical difference between the samples with levan and levan + amino acids (p-value < 0.05).

