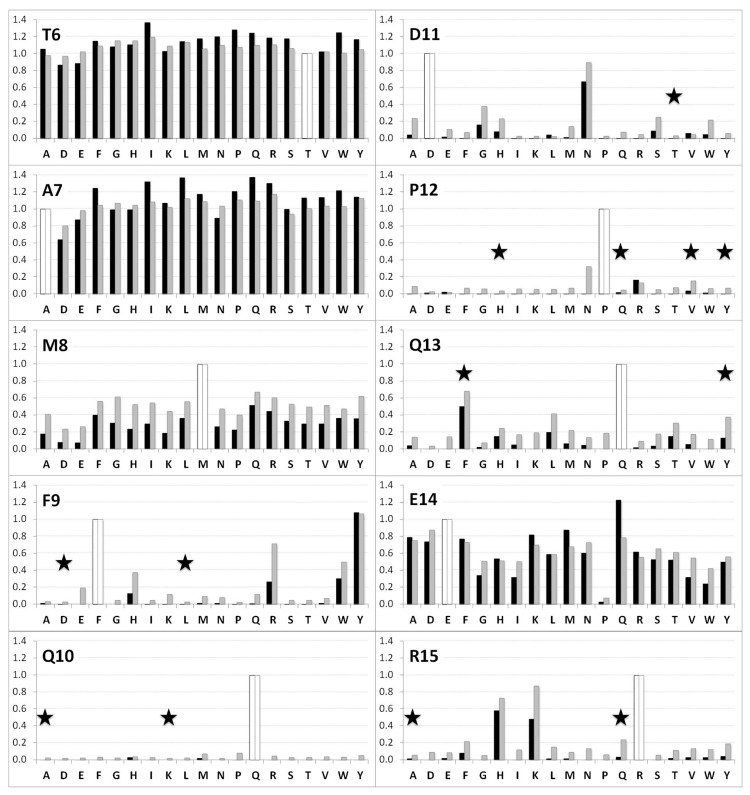
Fig 2. Comparison of the two WT permutation patterns.
Intensities were normalized with respect to the mean intensity recorded for the scFv1F4—WT peptide interaction. Black and grey bars correspond to the normalized intensities in arrays A and B, respectively. White bars represent the WT sequence (normalized value = 1). Stars indicate single replacements in starting variants (see Table 1).

