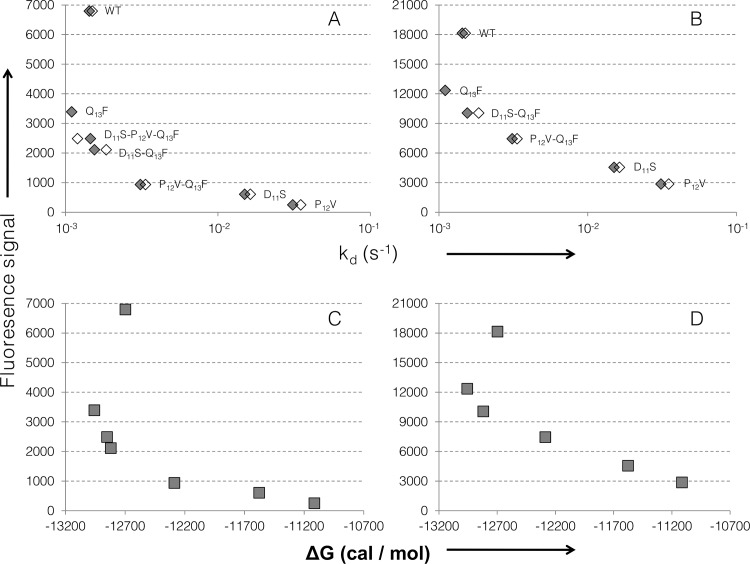
Fig 6. Correlation between SPR constants and fluorescence signals.
The kd (A, B) and ΔG (C, D) values are plotted against fluorescence signals from arrays A (A,C) and B (B,D). The kd as measured in HBS (grey markers) and HBS-200 (white markers) is shown in log scale. Peptide names are indicated in A and B.

