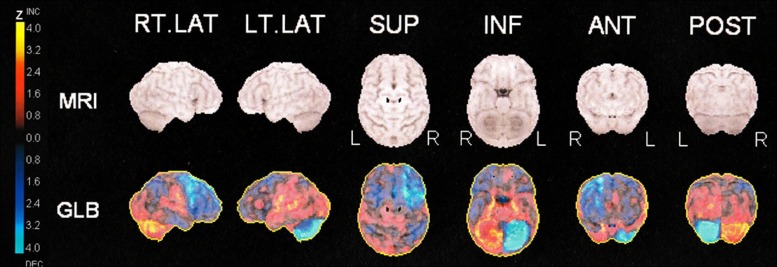
Fig 2. Quantitative 3-dimensional surface projection-analysis of FDG-uptake in patient no 25.
PET-images of patient no. 25 are normalized to whole brain using a database of normal subjects and scaled to Z values from - 4.0 to 4.0 (Neurostat). Projections of Z values are shown onto, respectively, the right and left lateral hemispheric surfaces, the superior and inferior surfaces, and the anterior and posterior surfaces. The uptake in the left cerebellar hemisphere is reduced in addition to uptake in the right frontal cortex. MRI surface projections are presented for anatomical reference in a standard stereotactic space

