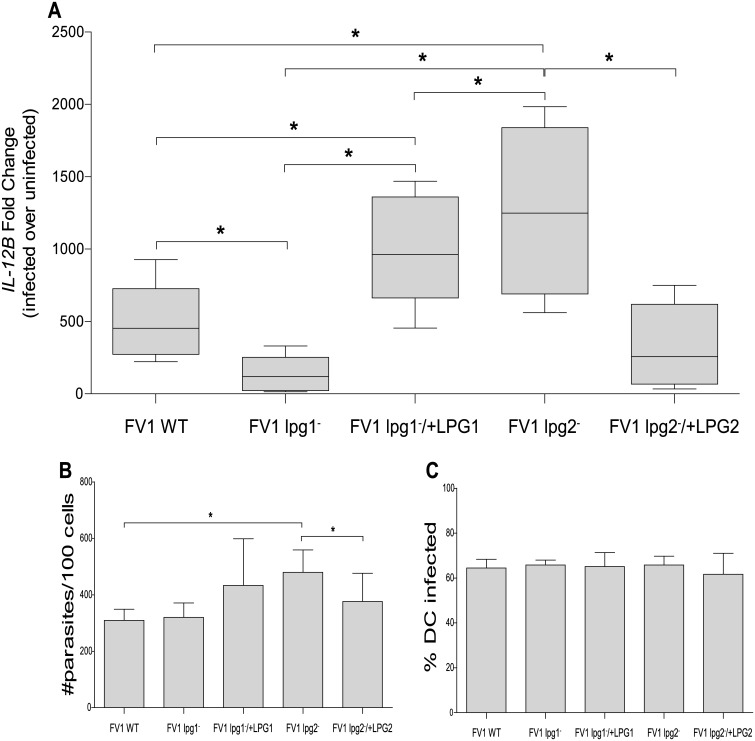
Fig 2. L. major FV1 lpg1 − and FV1 lpg2 − modulate the IL12B response in hDCs.
Human DCs (n = 9 donors) were infected with L. major FV1 parasites: L. major FV1 (WT), LPG null mutant (FV1 lpg1 −), LPG add back (FV1 lpg1 −/+LPG1), PG null mutant (FV1 lpg2 −), or PG add back (FV1 lpg2 −/+LPG2). (A) At 8 hours post infection, IL12B expression was measured by qRT-PCR. Fold changes were calculated using the ΔΔCT method and are represented as fold change over uninfected samples. Box plots display the median value (line), the interquartile range (box), and Tukey whiskers encompassing data within 1.5 fold of the interquartile range. All values were significantly greater than uninfected. Aliquots from the infected hDC samples were prepared by Diff-Quick staining and visualized by light microscopy. (B) The parasite index (#parasites/100 cells) and (C) the percentage of infected cells (%DC infected) is displayed. Mean values of individual donors ± SD are presented. *Statistical significance (p<0.05).

