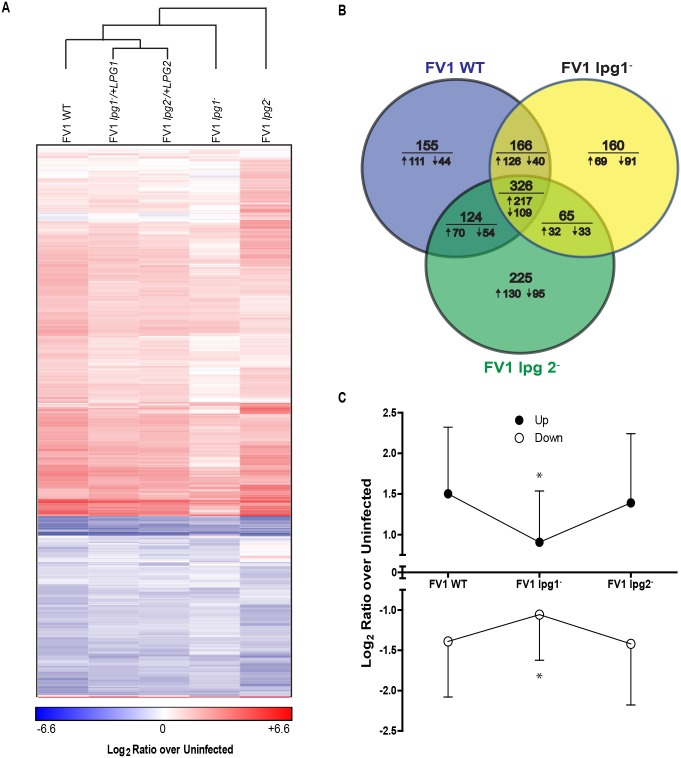
Fig 5. Leishmania major human host dendritic cells gene expression profiles.
(A) Gene transcript expression heat map of in vitro infected monocyte-derived hDCs. The color scale is based on average log2 ratios of RMA-normalized microarray gene probe set values for variably infected host cells over uninfected cells. Only the genes that displayed significant differential expression by z-ratios, from both uninfected samples and between infections with FV1 WT and FV1 lpg1 − or FV1 lpg2 − mutants or their respective add back strains, were included in the map. Genes and sample types were clustered by city block distance metric using average linkage in GENE-E. (B) Venn diagrams with the number of host DC genes significantly differentially expressed from uninfected samples in FV1 WT, FV1 lpg1 −, and FV1 lpg2 − mutants as quantified by microarrays. Values below the horizontal line indicate the number of genes from the above total that were up- (↑) or down-regulated (↓) compared to uninfected samples. (C) Total average log2 ratios of up- and down-regulated genes significantly differentially expressed from uninfected samples in FV1 WT, FV1 lpg1 −, and FV1 lpg2 − mutants as quantified by microarrays, plus or minus standard deviation. *Significant difference of log2 ratio values (p<0.05) between FV1 lpg1 − infected DCs compared to FV1 WT and FV1 lpg2 − infected DCs by ANOVA with Bonferroni multiple comparisons test.

